Photoessay: How to assess the habitat of your local stream
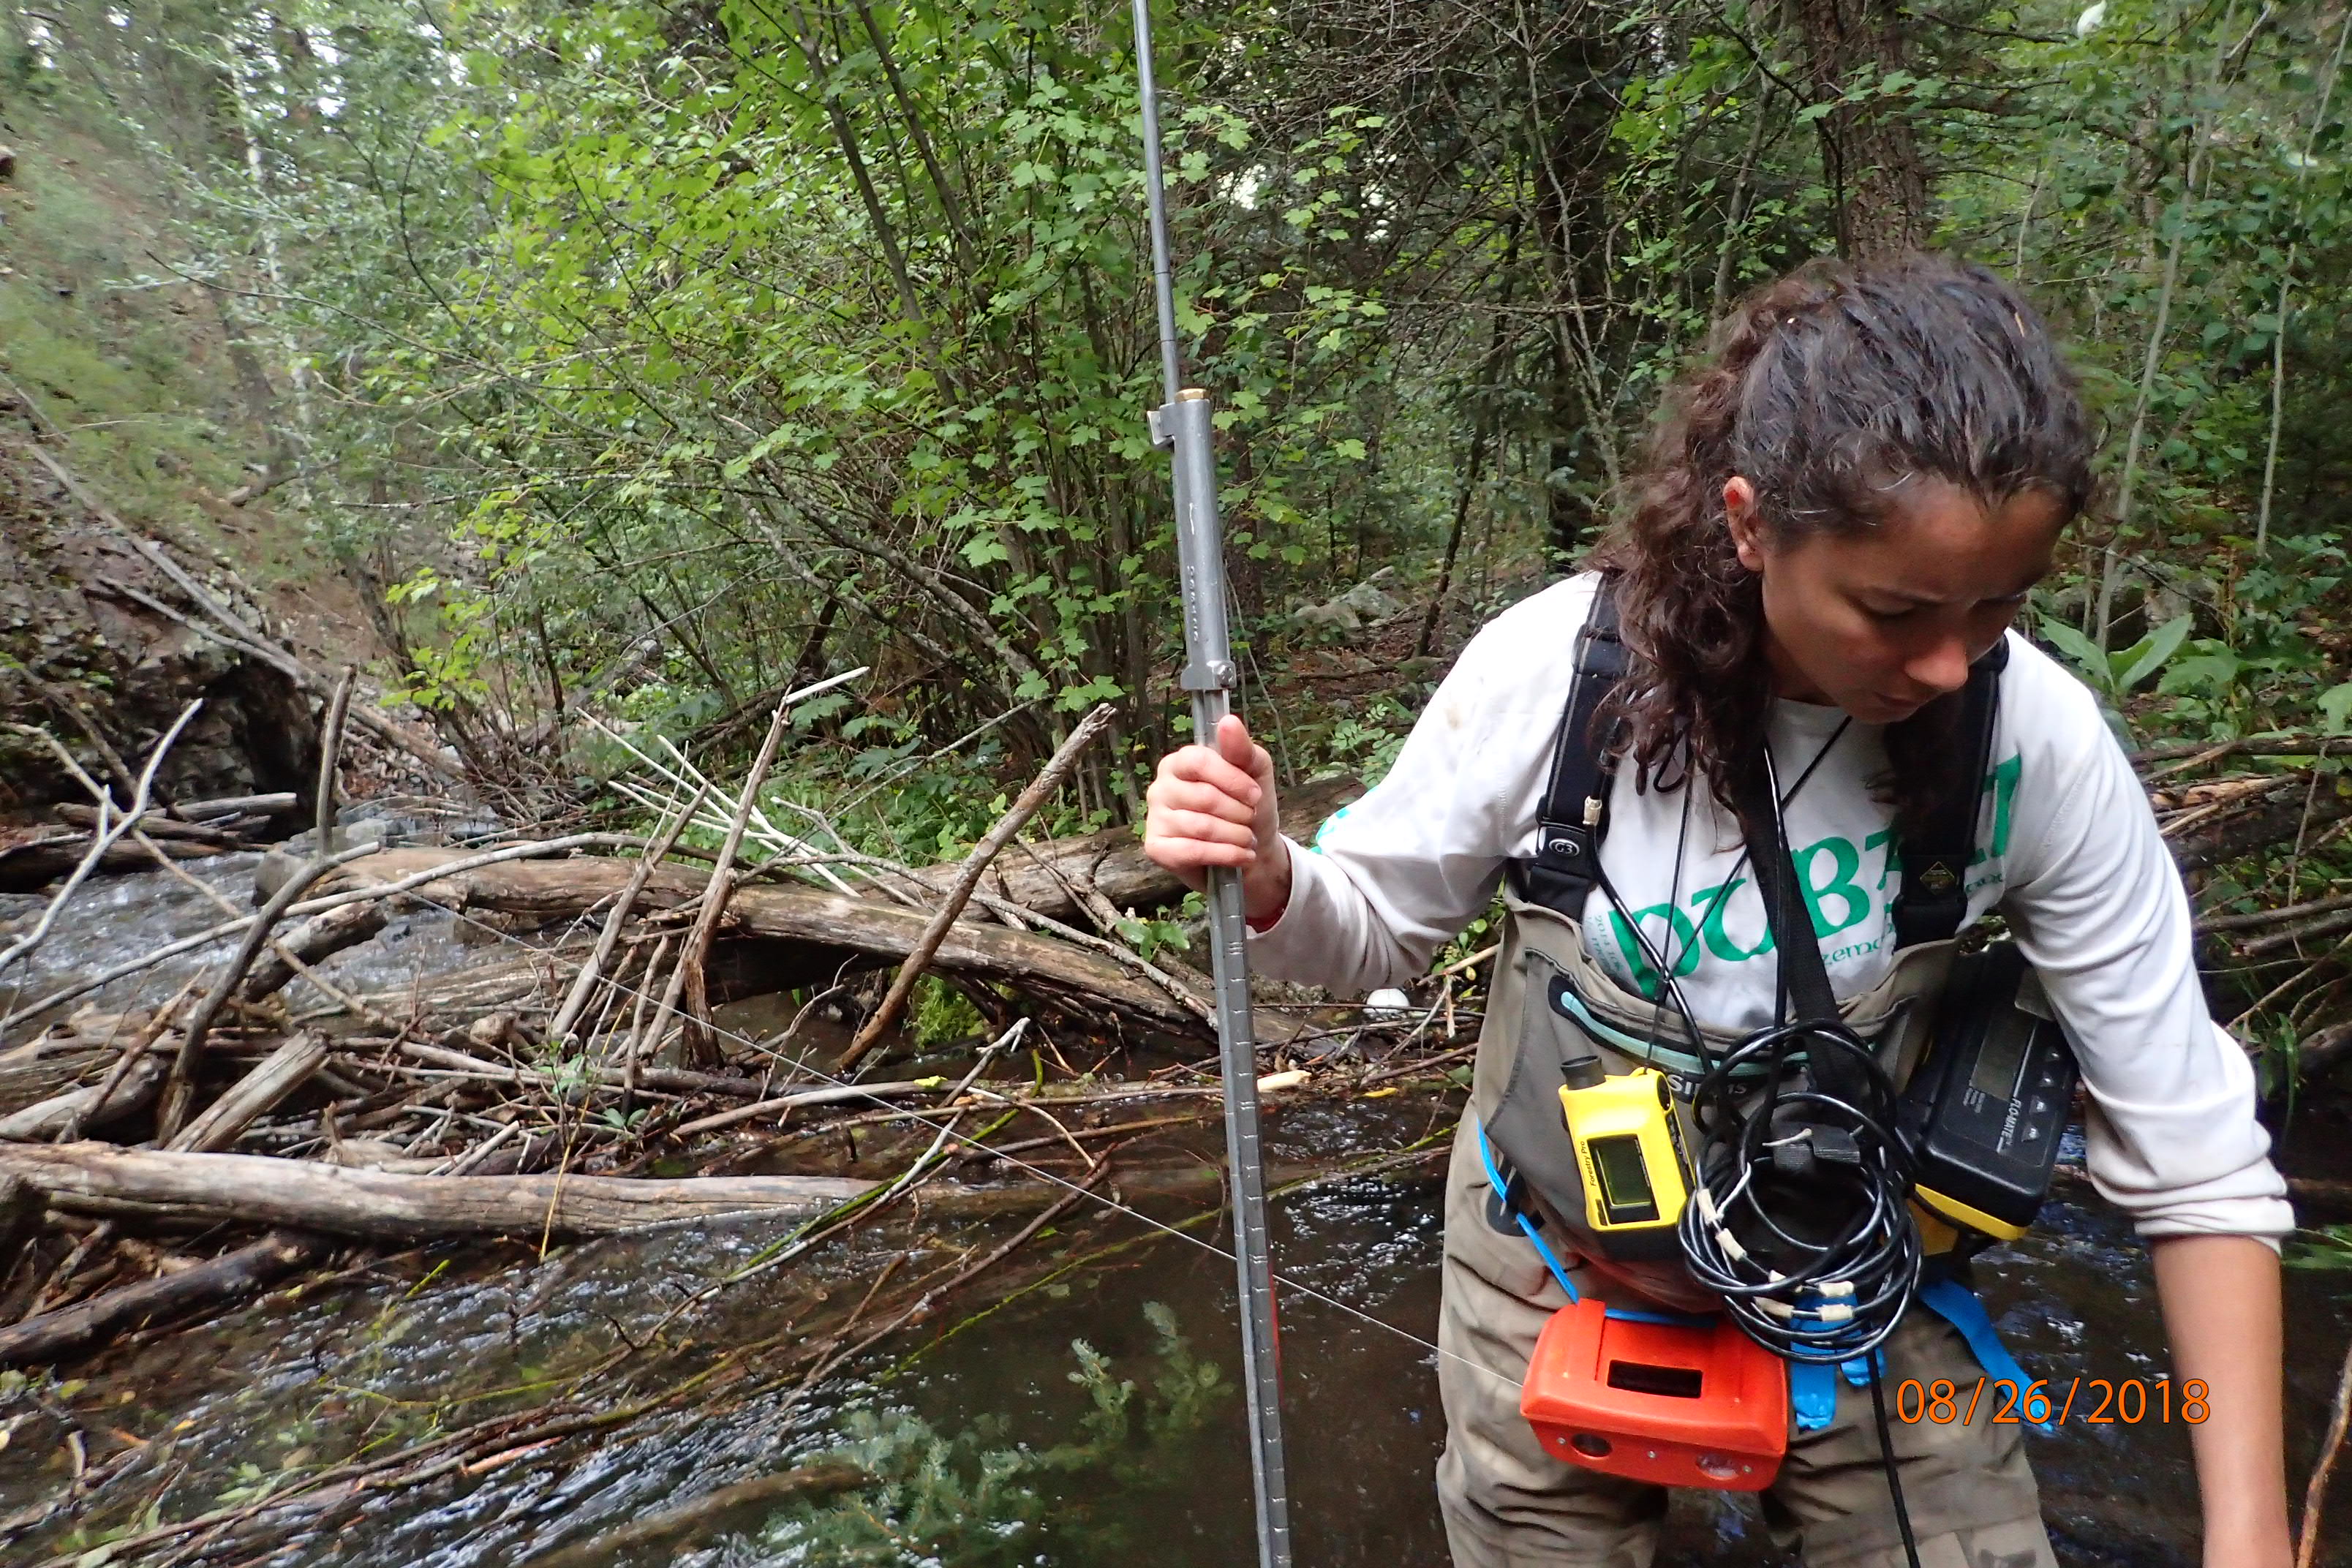
Photo: T. Rossettie
When ecologists need to assess stream habitat to make sure it is healthy for a fish population, they often choose to quantify rather than qualify the characteristics of the habitat. Both quantitative and qualitative data are useful for scientists, with quantification opting for measurement over description. For example, quantitative data about the velocity of a river would be “5 meters per second” while qualitative data would be “the river is moving fast”. Quantitative data are more objective and can be accurately compared across space and time. If you are curious about the health of your local stream, follow this guide to learn appropriate data gathering techniques for fish habitat assessment.
Streams assessed for fish habitat quality are commonly characterized by their water quality, wetted width, depth, velocity, and substrate. Below, I illustrate and briefly describe the nuts and bolts of collecting these data using images from my lab’s recent fieldwork in northern New Mexico. Some of the photos are from my thesis research on native Rio Grande Cutthroat trout, and the other photos are from an ongoing biomonitoring project in the Valles Caldera National Preserve. Some of these data are collected by trained technicians using special instruments, but many measurements can be performed by citizen scientists armed with only a buddy, a measuring tape, and a smartphone. For additional videos and information, follow the hyperlinks (highlighted in blue).
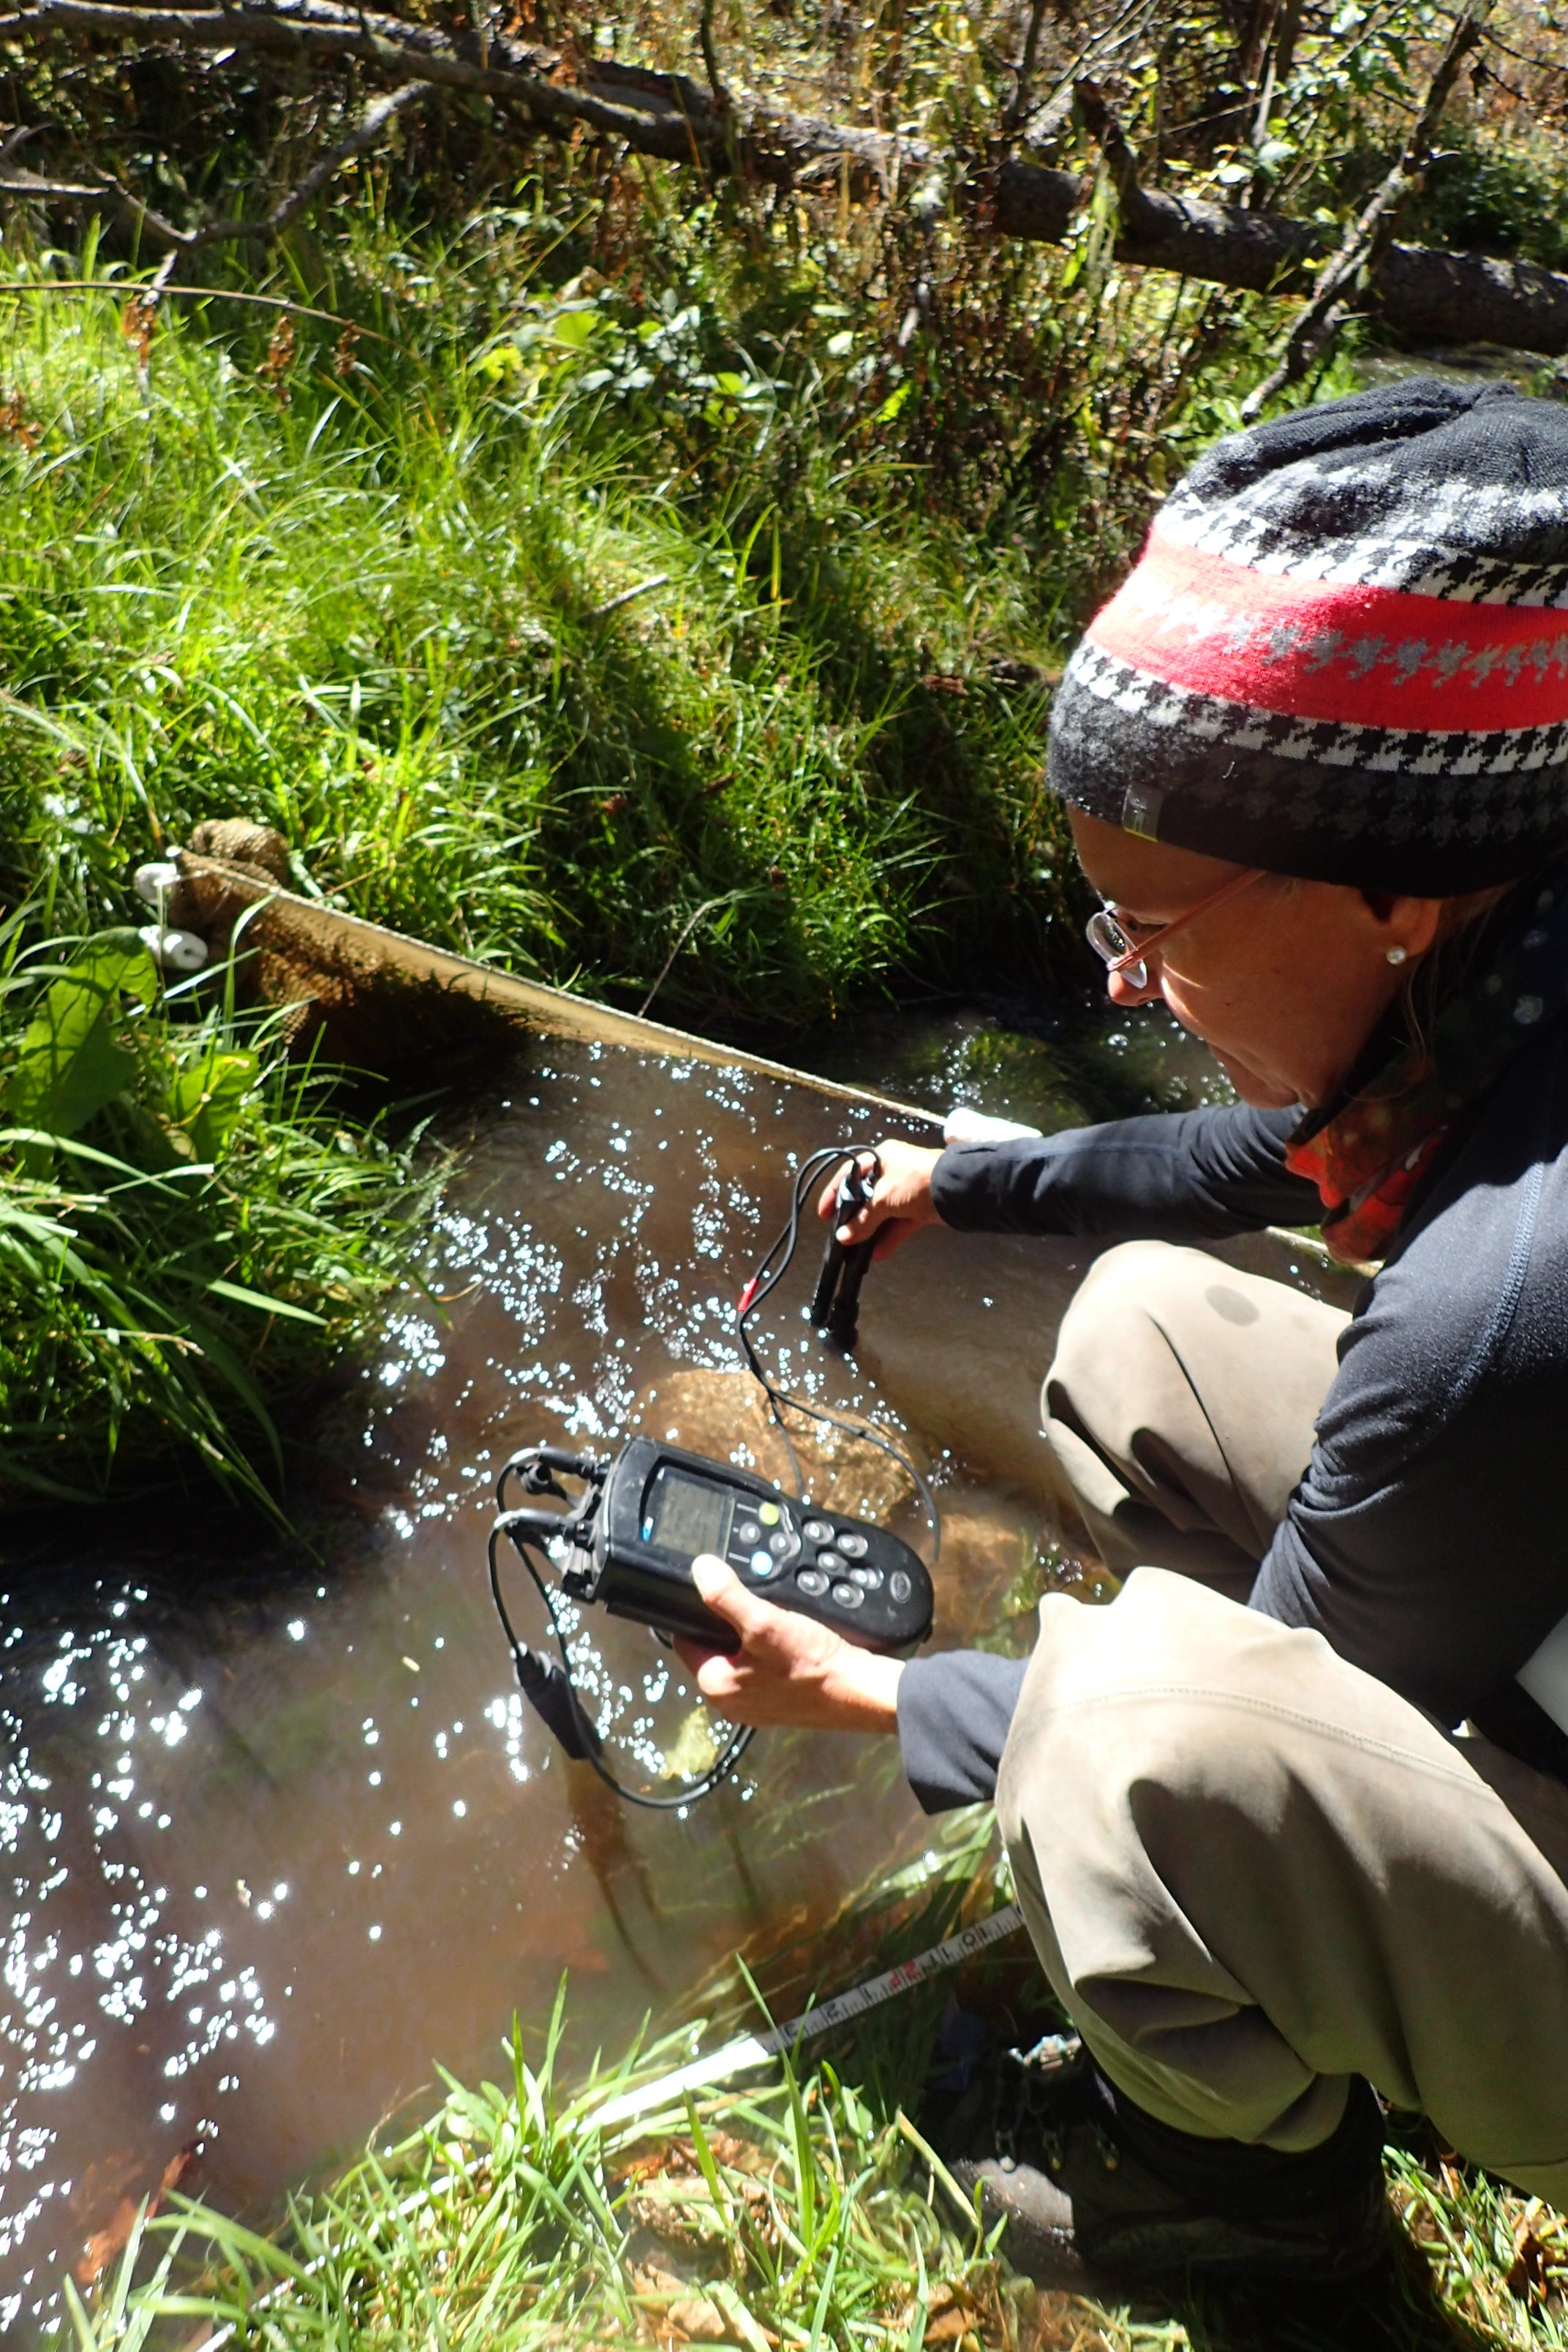
Figure 1. Measuring dissolved oxygen and temperature using a water quality meter. Photo: L.Flynn
Water Quality
Scientists use a special meter fitted with probes that can instantly read the temperature and levels of dissolved oxygen (DO) of the water (Figure 1). If you do not have this special meter, then you can use a normal thermometer to measure the water temperature. Dissolved oxygen levels cannot be easily measured without a probe or specific chemicals, but generally cold water holds more oxygen. So, if your stream is below 10°C, then the oxygen levels are likely high. You can also look for areas where oxygen is being mixed into the stream, such as riffles where the water boils over shallow rocks. Without these areas, oxygen levels may be low.
Trout are cold water specialists, so healthy trout streams range between 5 and 20°C depending on the time of day and season. High levels of dissolved oxygen is critical for the trout’s active, oxygen-demanding lifestyle. Trout require a minimum DO of 4mg/L, but perform best at values greater than 7mg/L.
Wetted Width
Wetted width is simply the width across the stream channel which currently contains water. You can easily measure wetted width by stretching a tape measure across the width of the stream channel perpendicular to the direction of flow (Figure 2). Wetted width is an important measurement for determining stream area and volume. Stream width changes with precipitation, season, and elevation. For example, stream width tends to be narrow high up in the mountains and wide down in the valleys. As a very general rule, narrow streams tend to support fewer fish than wider streams.
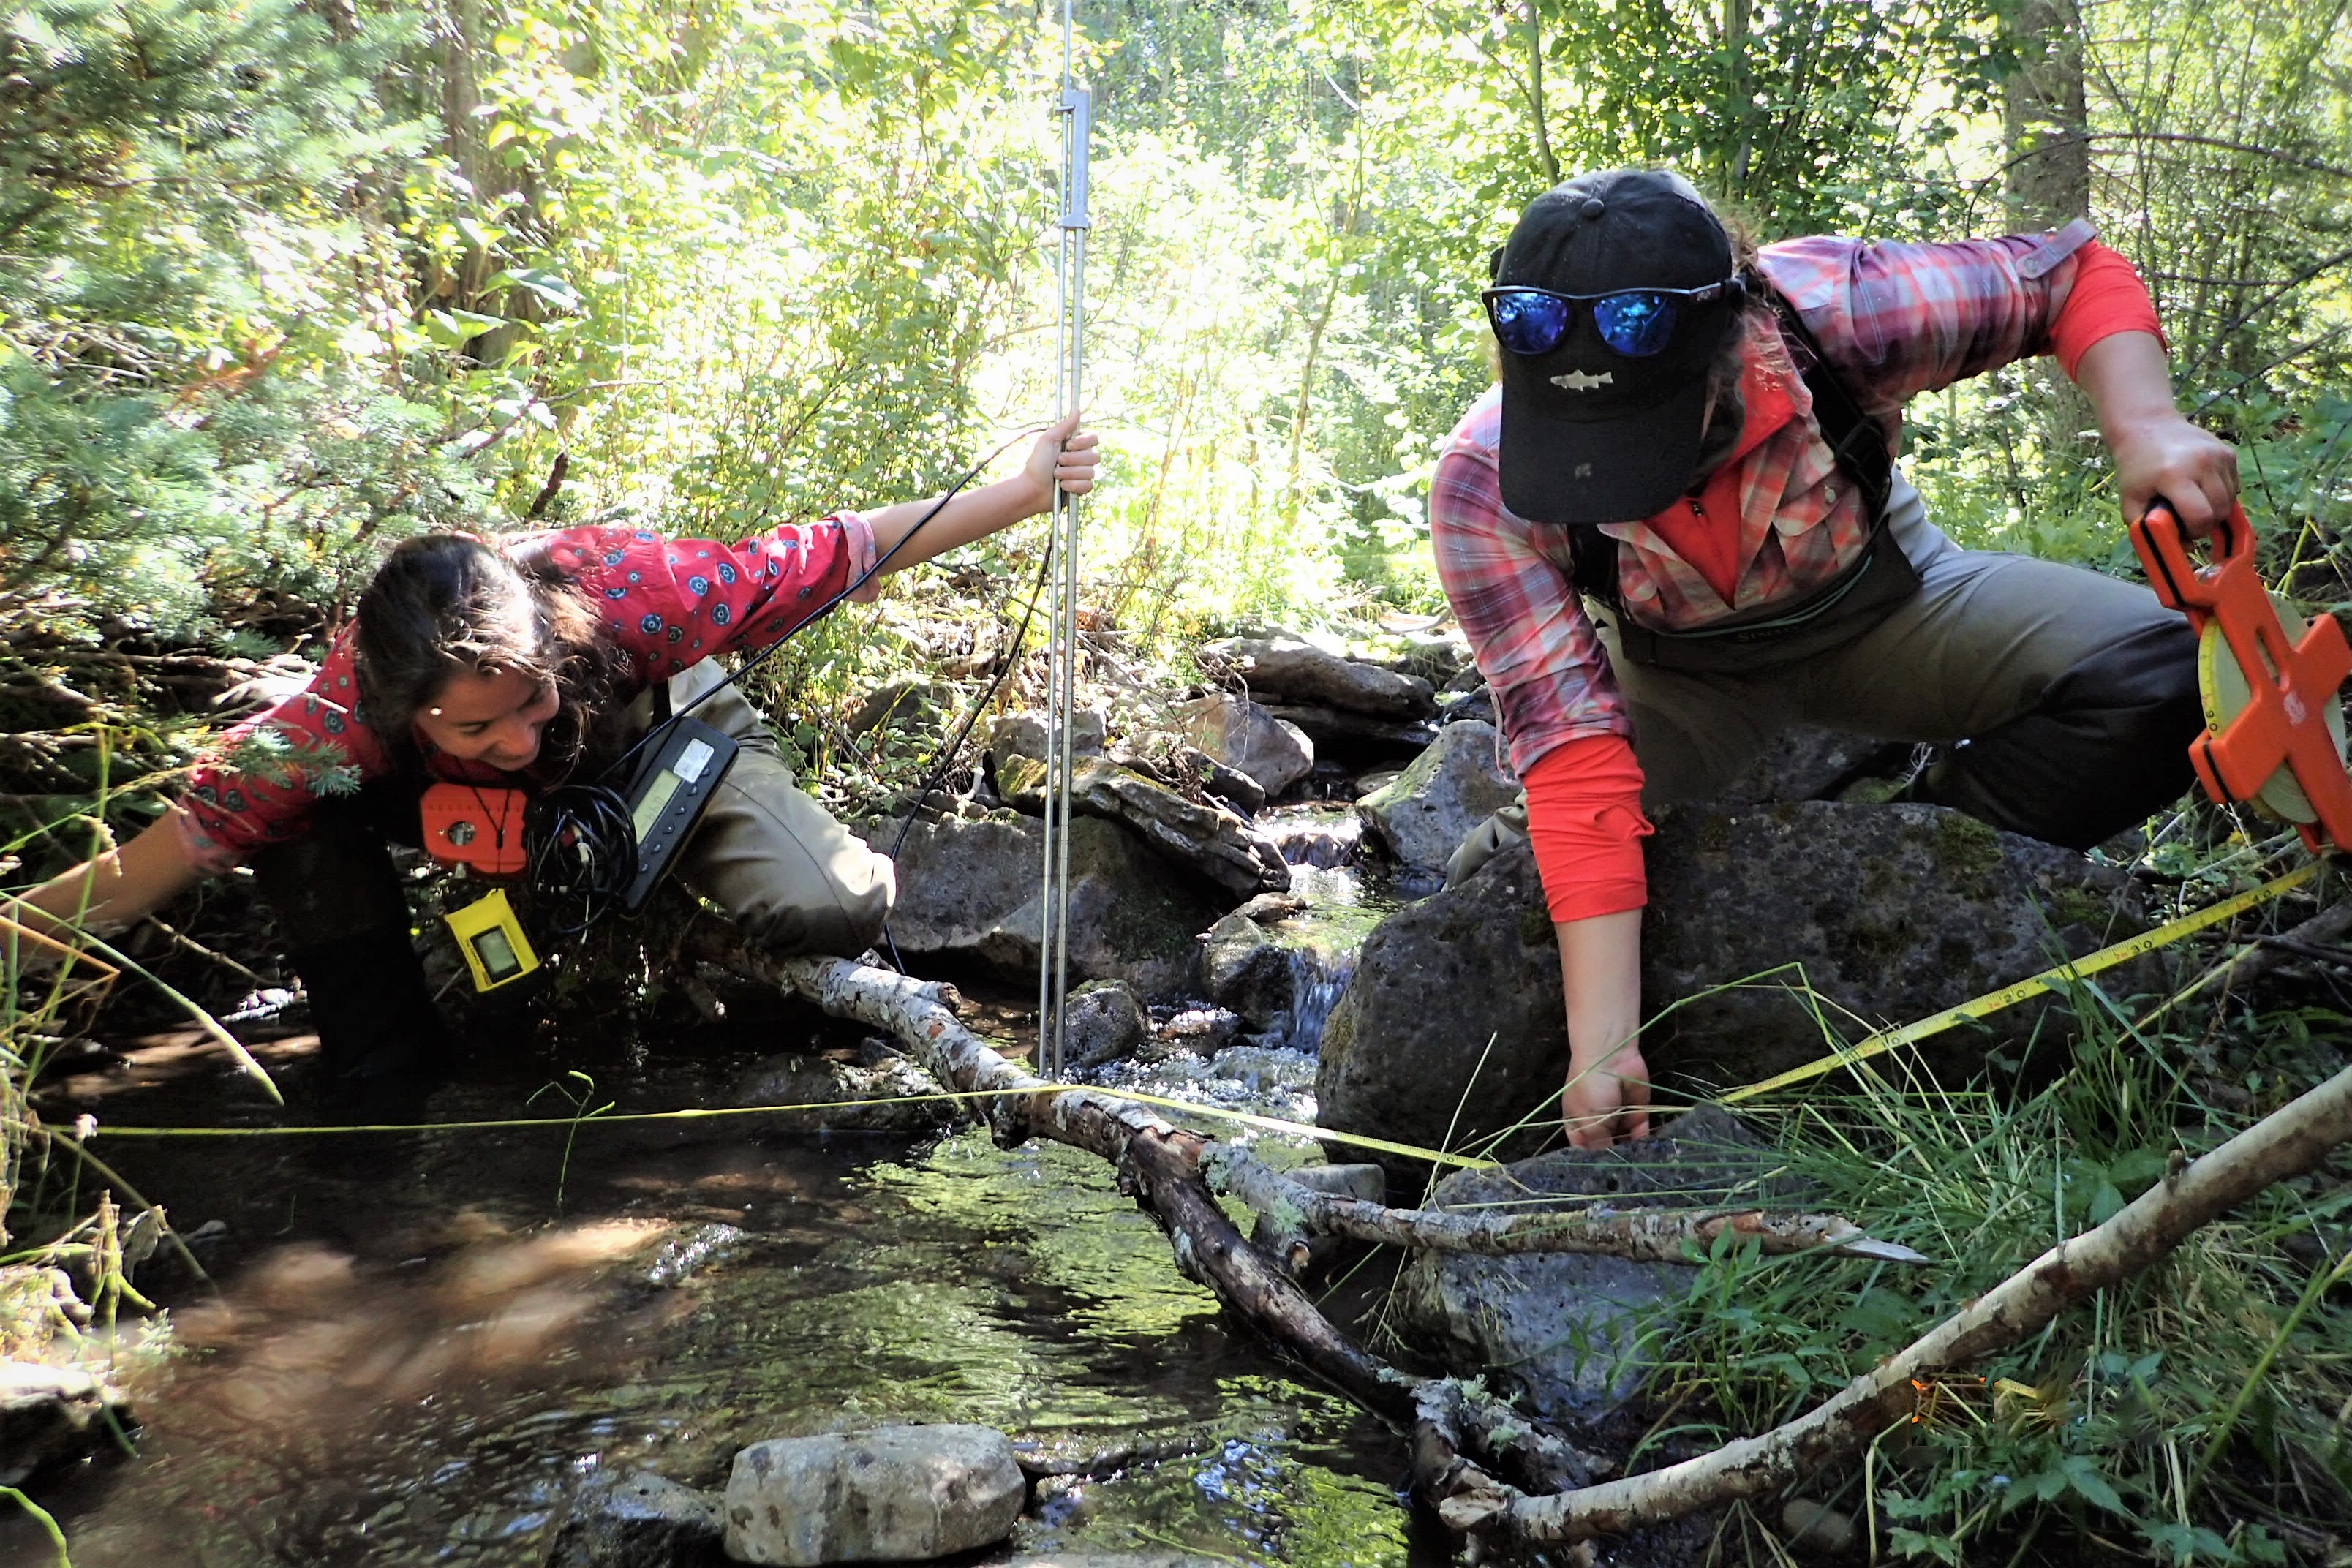
Figure 2. Stretching the measuring tape across the creek. Photo: C. Caldwell.
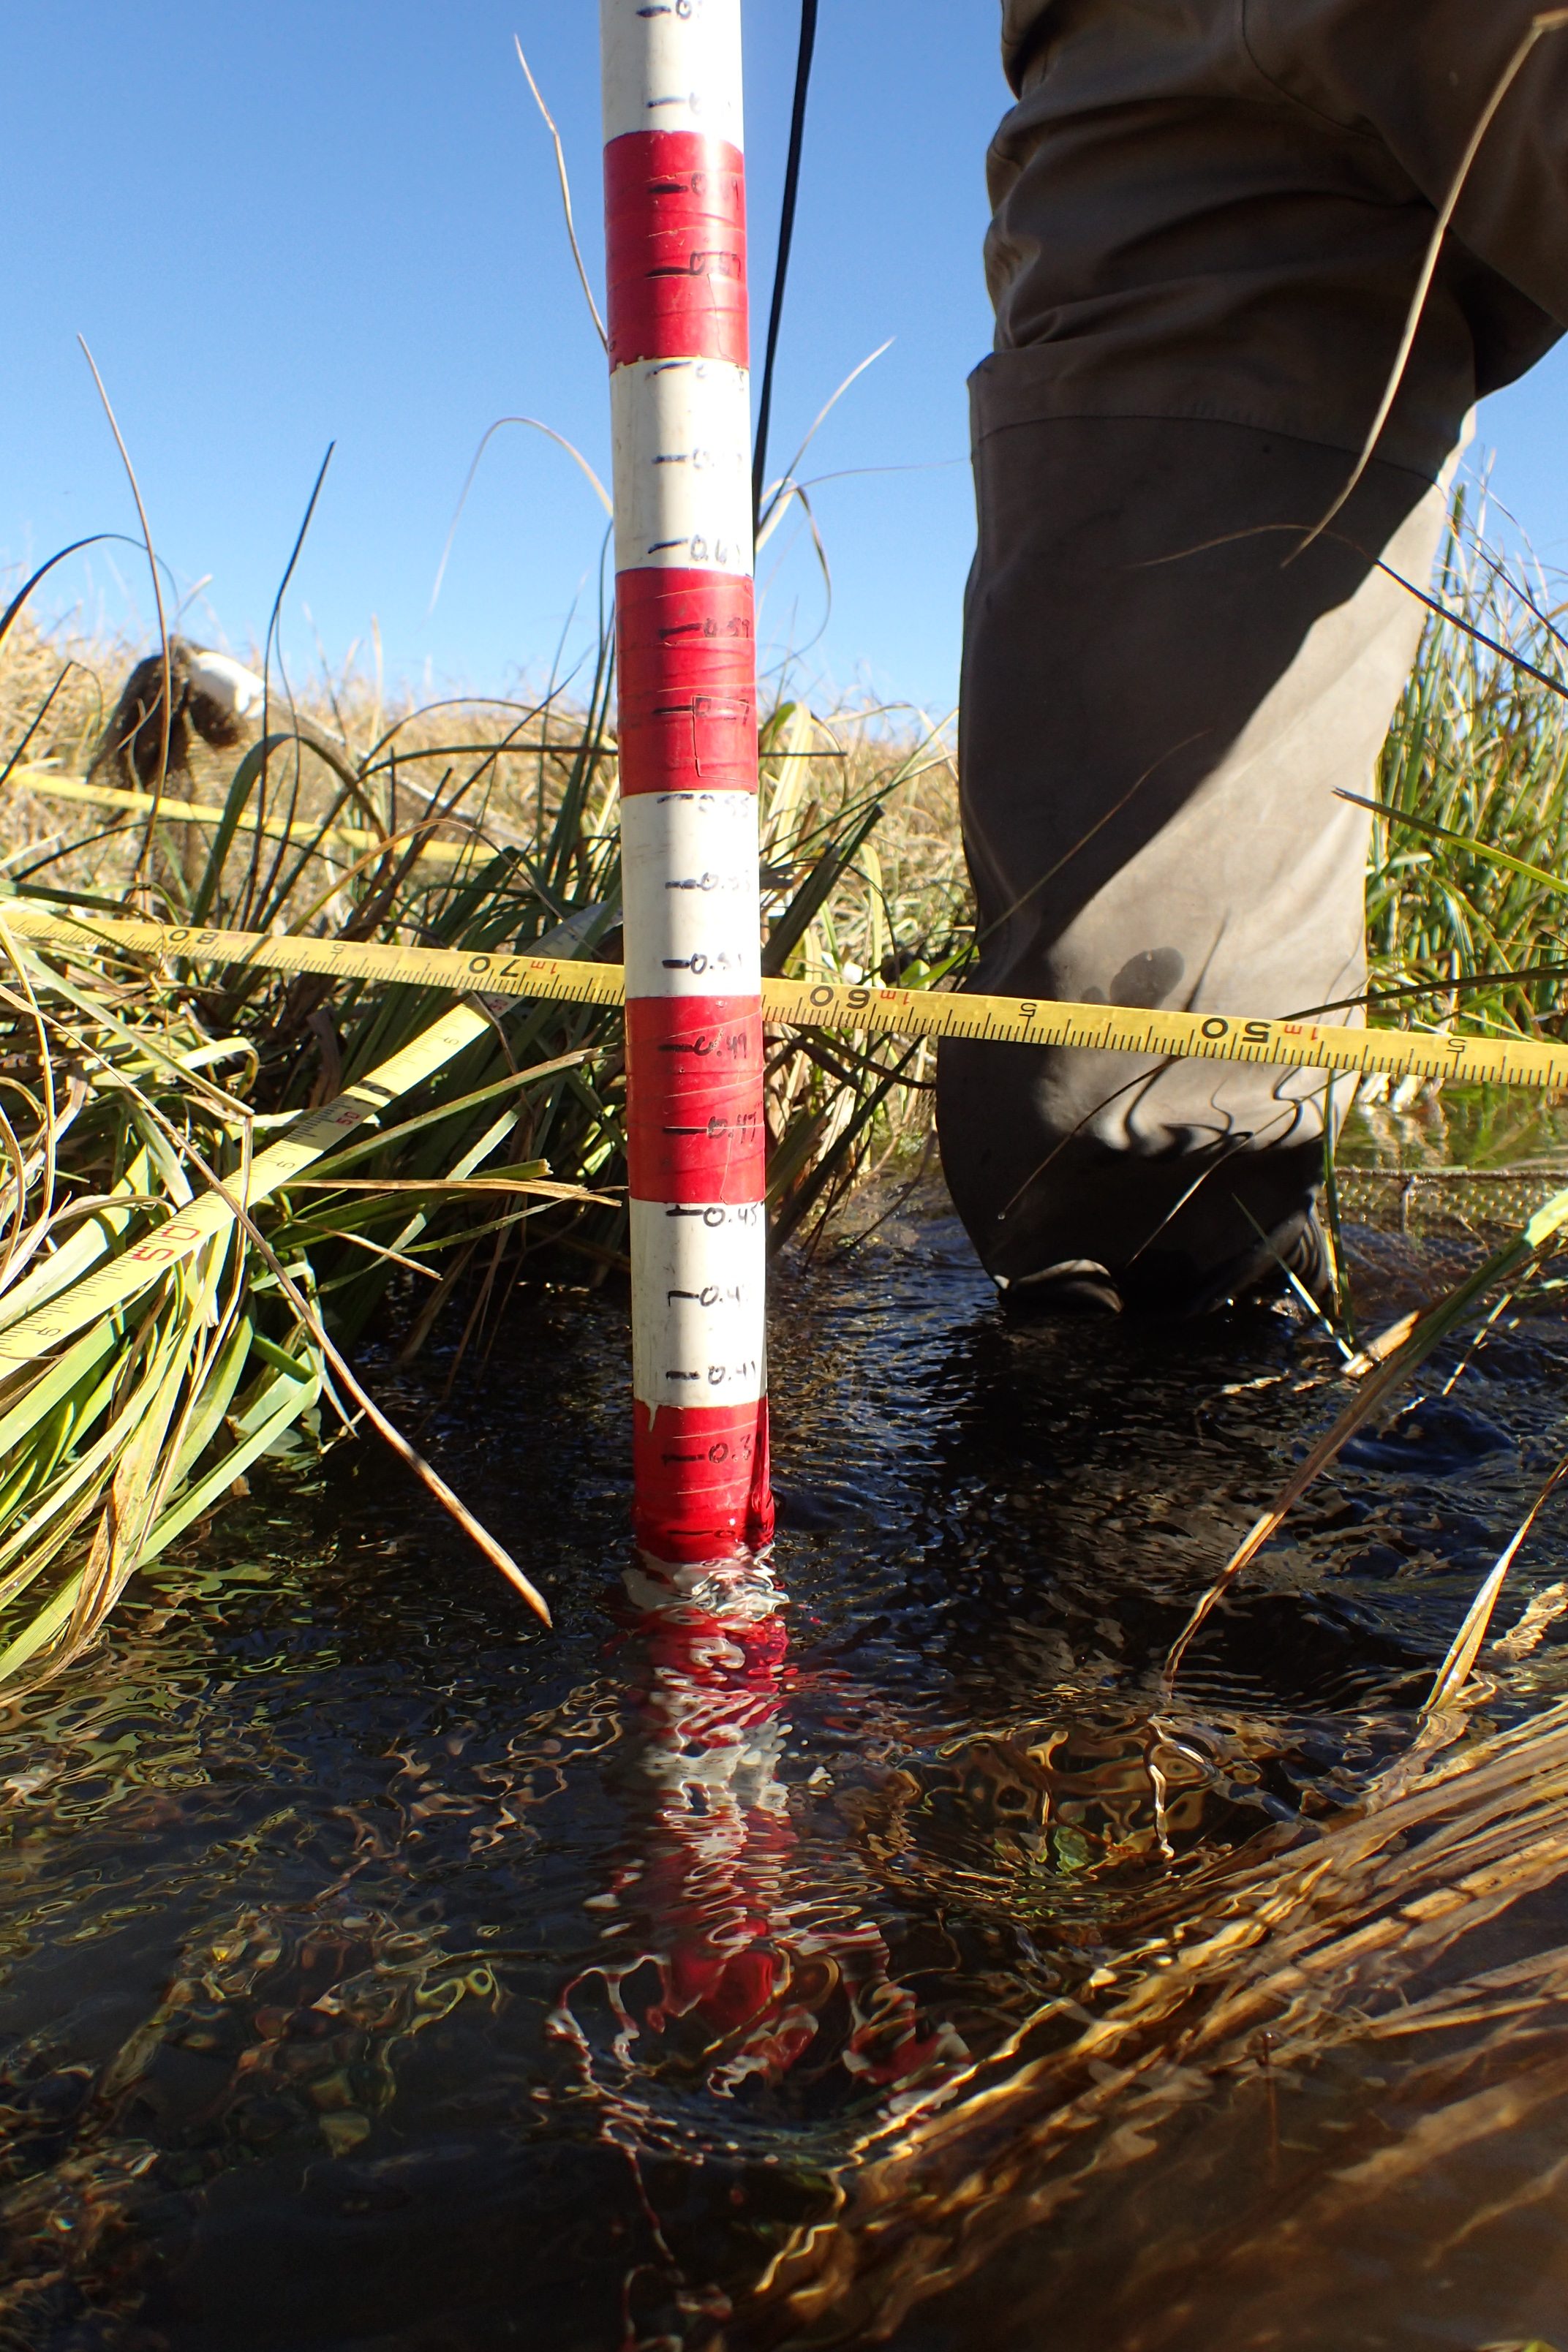
Figure 3. Meter stick measuring depth. Photo: L. Flynn.
Depth
We measure depth from the stream bed to the water’s surface using a measuring stick (Figure 3). Depth is an important measurement for calculating stream area and discharge (volume of water). Depth changes seasonally and also correlates with hydrological features. For example, depths are generally greater in the spring and shallow in the fall, and pools tend to be deeper than riffles. Therefore, take depth measurements at multiple locations throughout the stream to find an average. Becoming aware of typical water depths throughout the seasons will help you recognize when the water might be running low, which could indicate stressful conditions for fish.
Velocity
Velocity is the speed of the water flowing through the channel. It is measured in meters per second, typically using a flowmeter (a speedometer for water, Figure 4a). Water tends to move more slowly near the streambed and more quickly at the surface, so we get a reliable average when we measure velocity at 60% depth. The top-set rod does the math for us (Figure 4b). We take multiple measurements to account for the large amount of spatial variation in velocity, being faster over riffles and slower in pools (Figure 4c). Another way to measure water velocity is by using an orange! You and your buddy should stand 1 m apart and time how long it takes for the orange to float that distance. Do this at least 3 times then take the average. When the average is multiplied by a corrective factor, the result is very similar to the flowmeter. For more instruction on DIY flow measurement without fancy gadgets, see here and here.
Like width and depth, flow is not uniform across space and time. It is subject to seasonal changes and also shifts radically within a stream depending on the shape and gradient of the channel. The speed of water has important implications for the life history of trout. For example, the water column is a food delivery system for trout. If it moves too slowly, not enough bugs are delivered. If it moves too quickly, trout can’t get to the bugs fast enough.
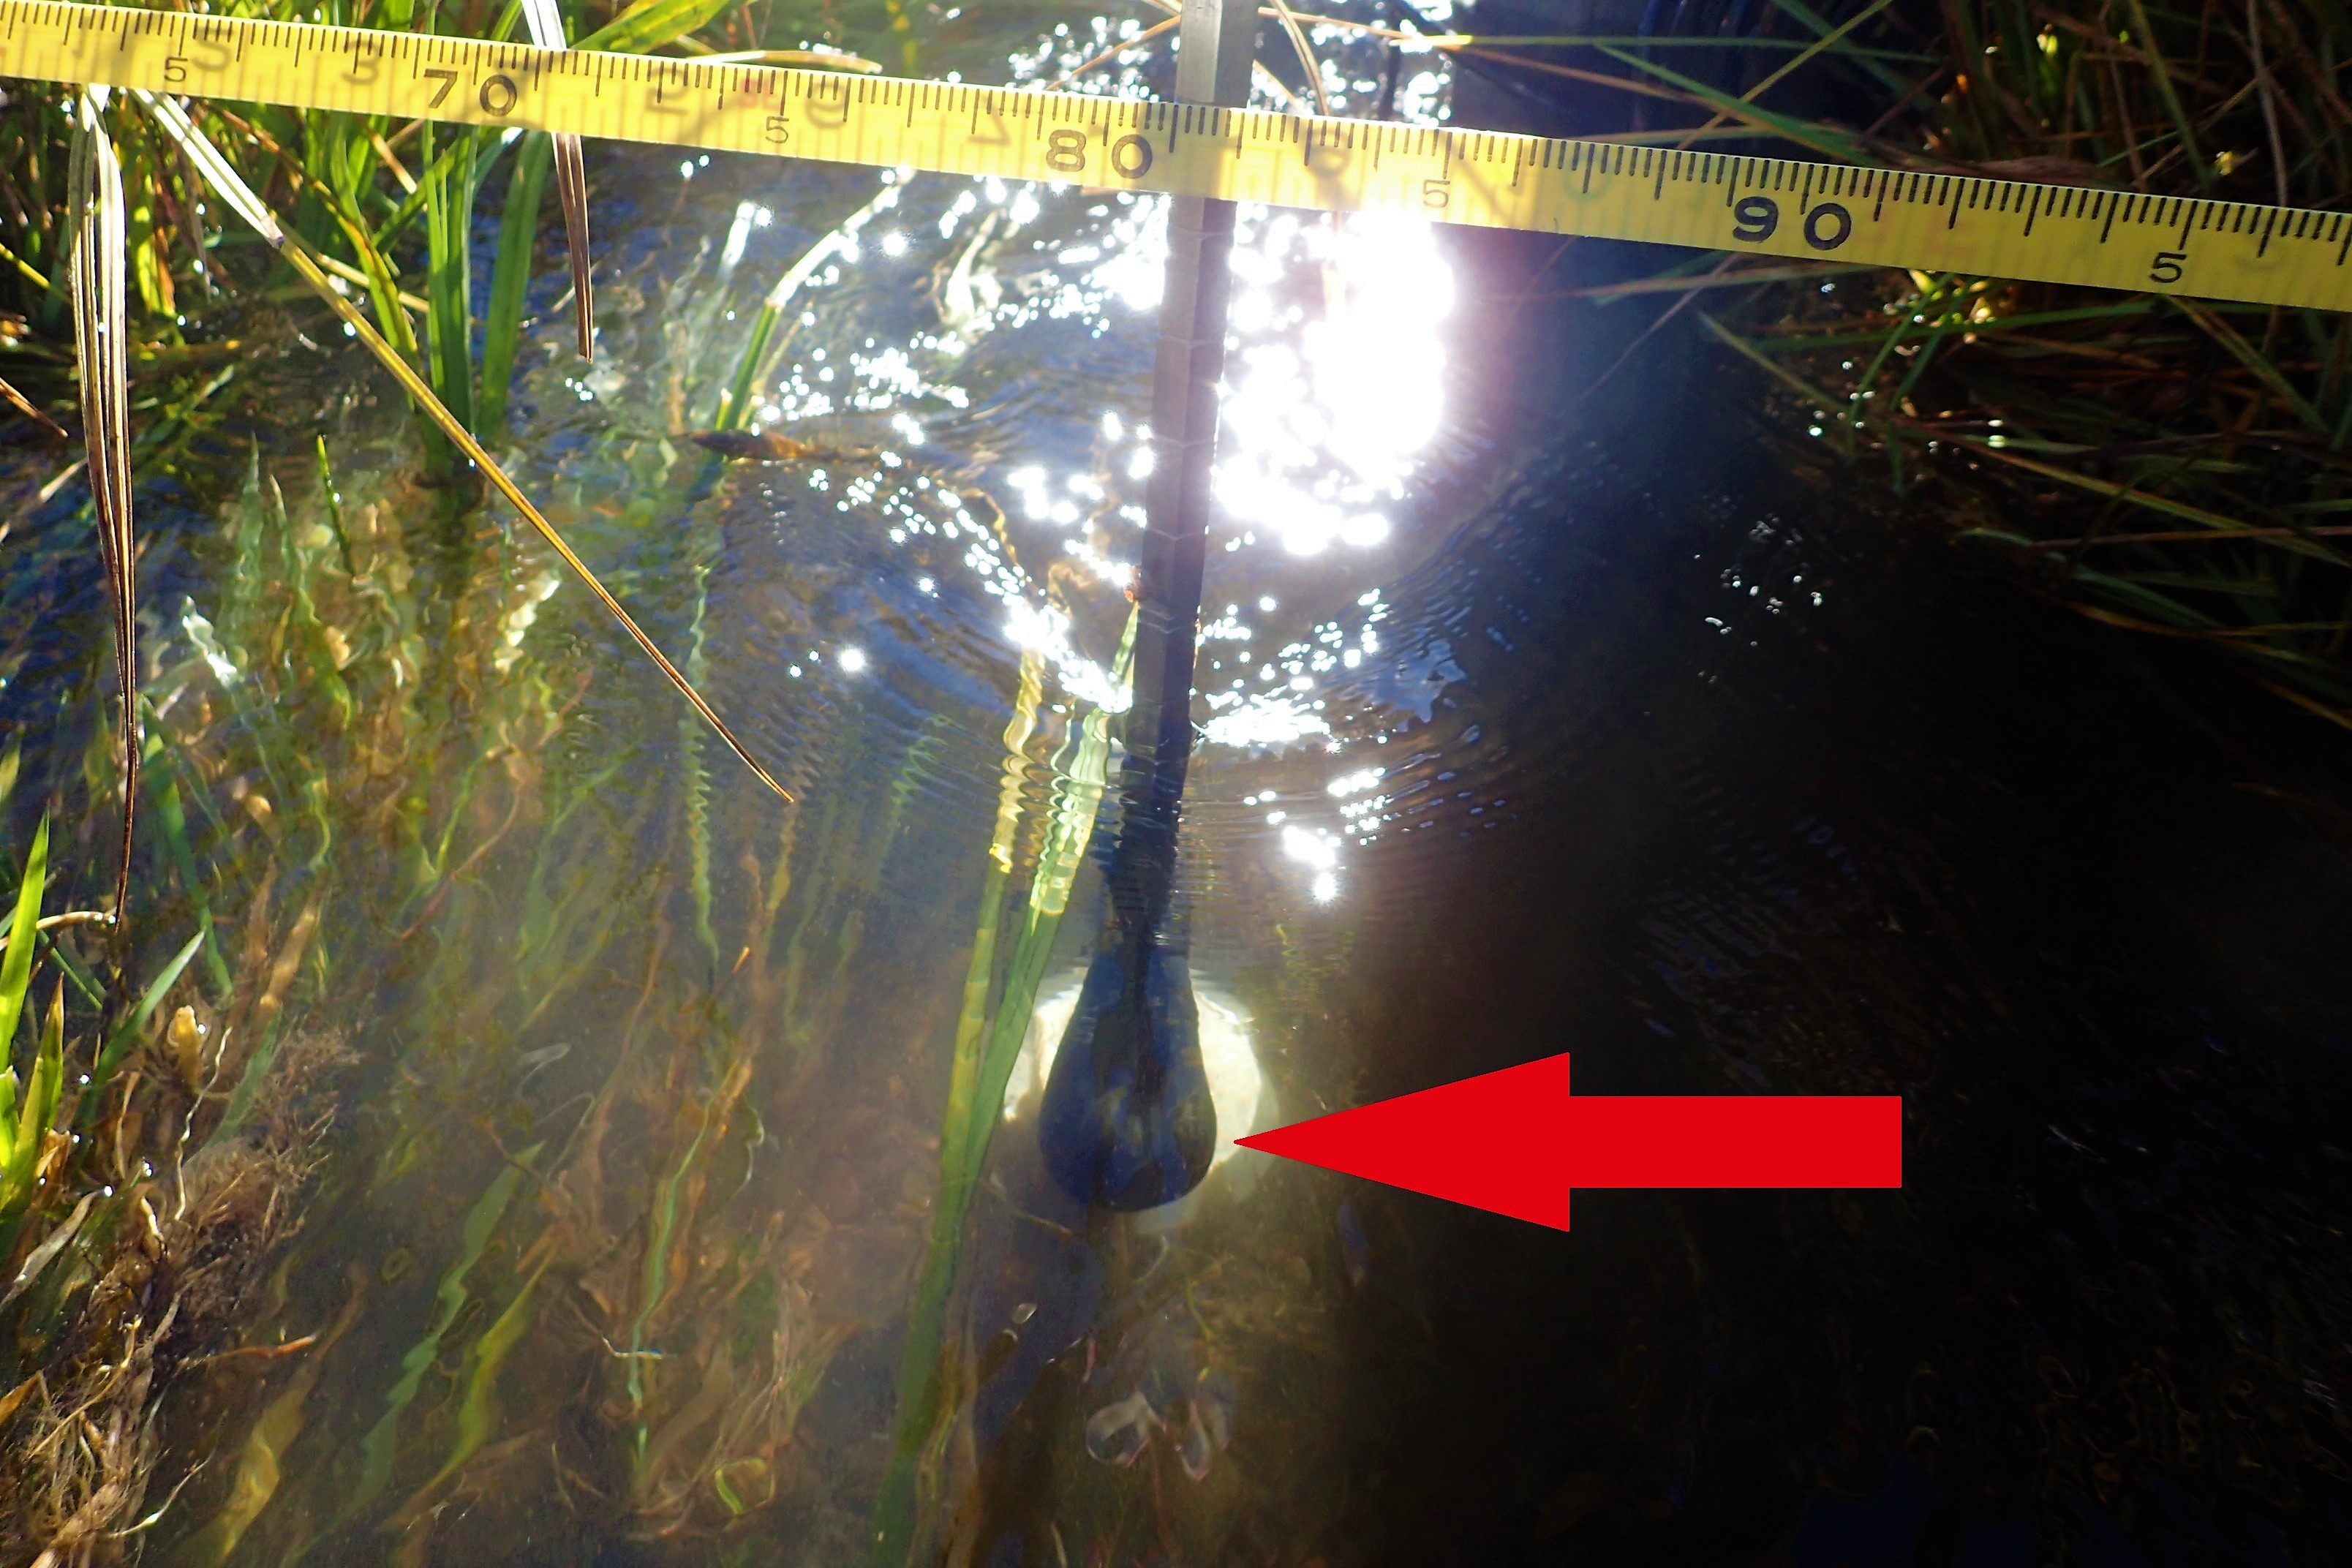
Figure 4a. The sensor (indicated by the red arrow) is pointed upstream to detect water speed. Photo: L. Flynn
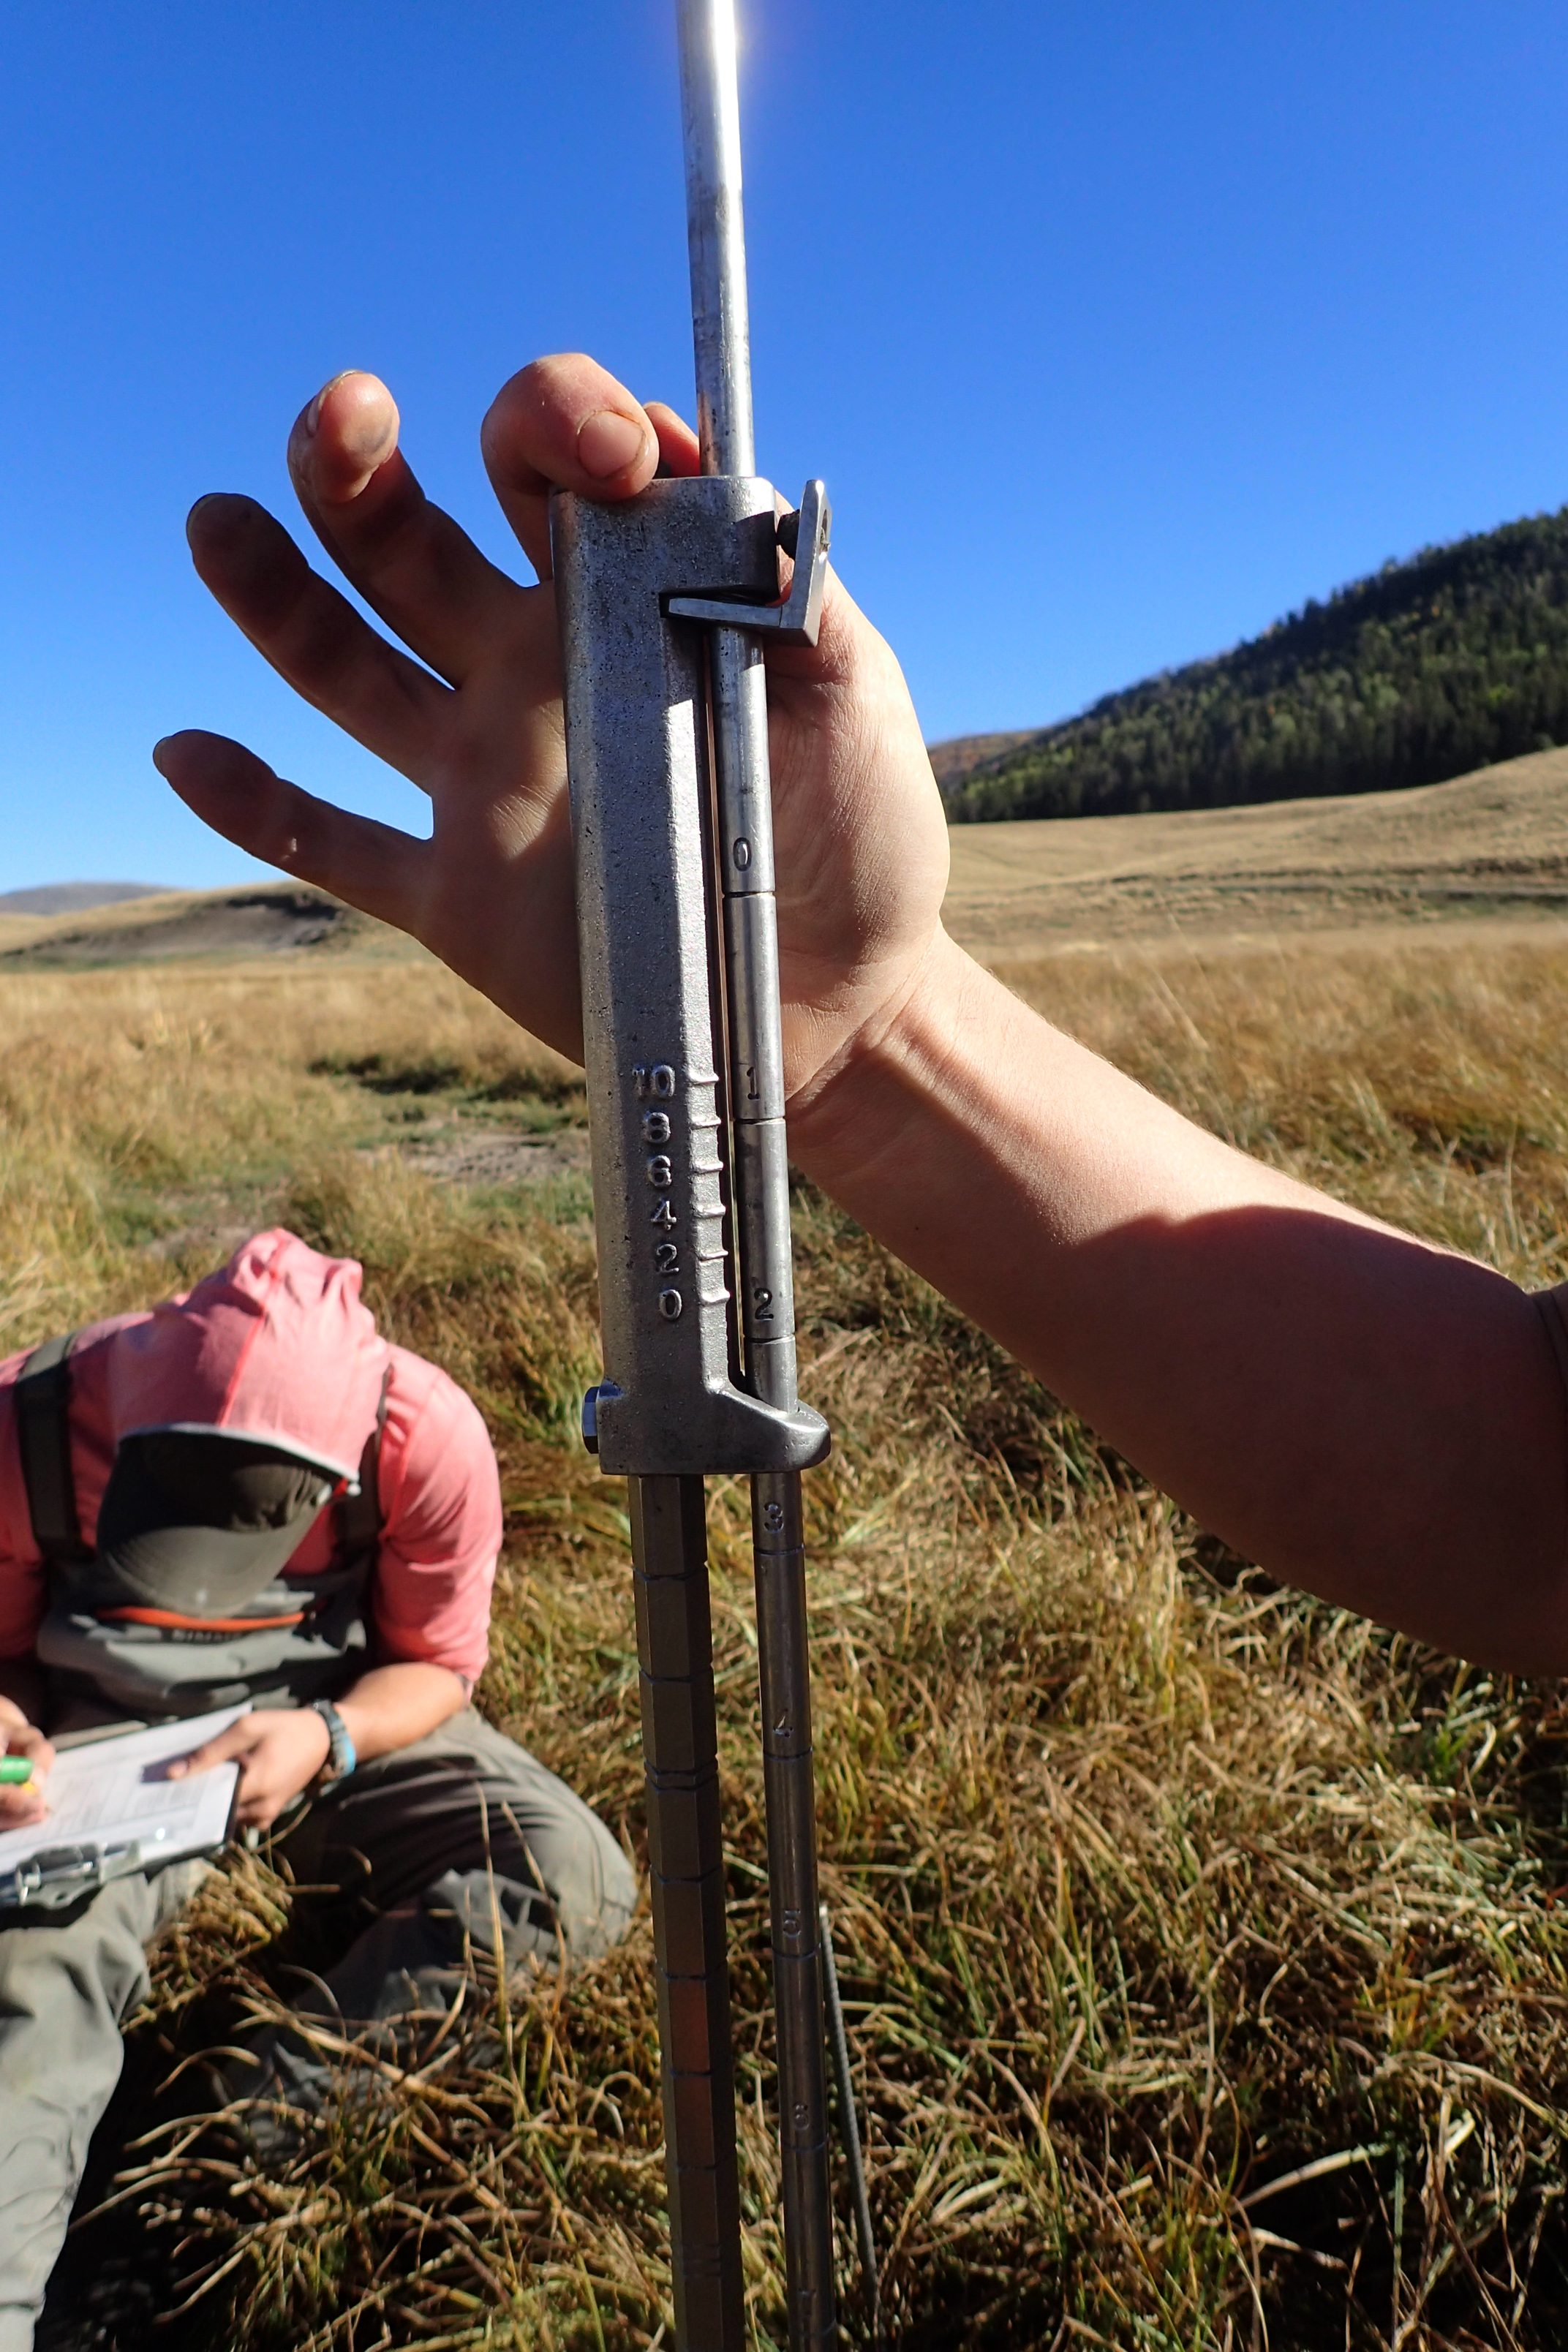
Figure 4b. The top-set rod is adjusted to 60% depth. Photo: L. Flynn
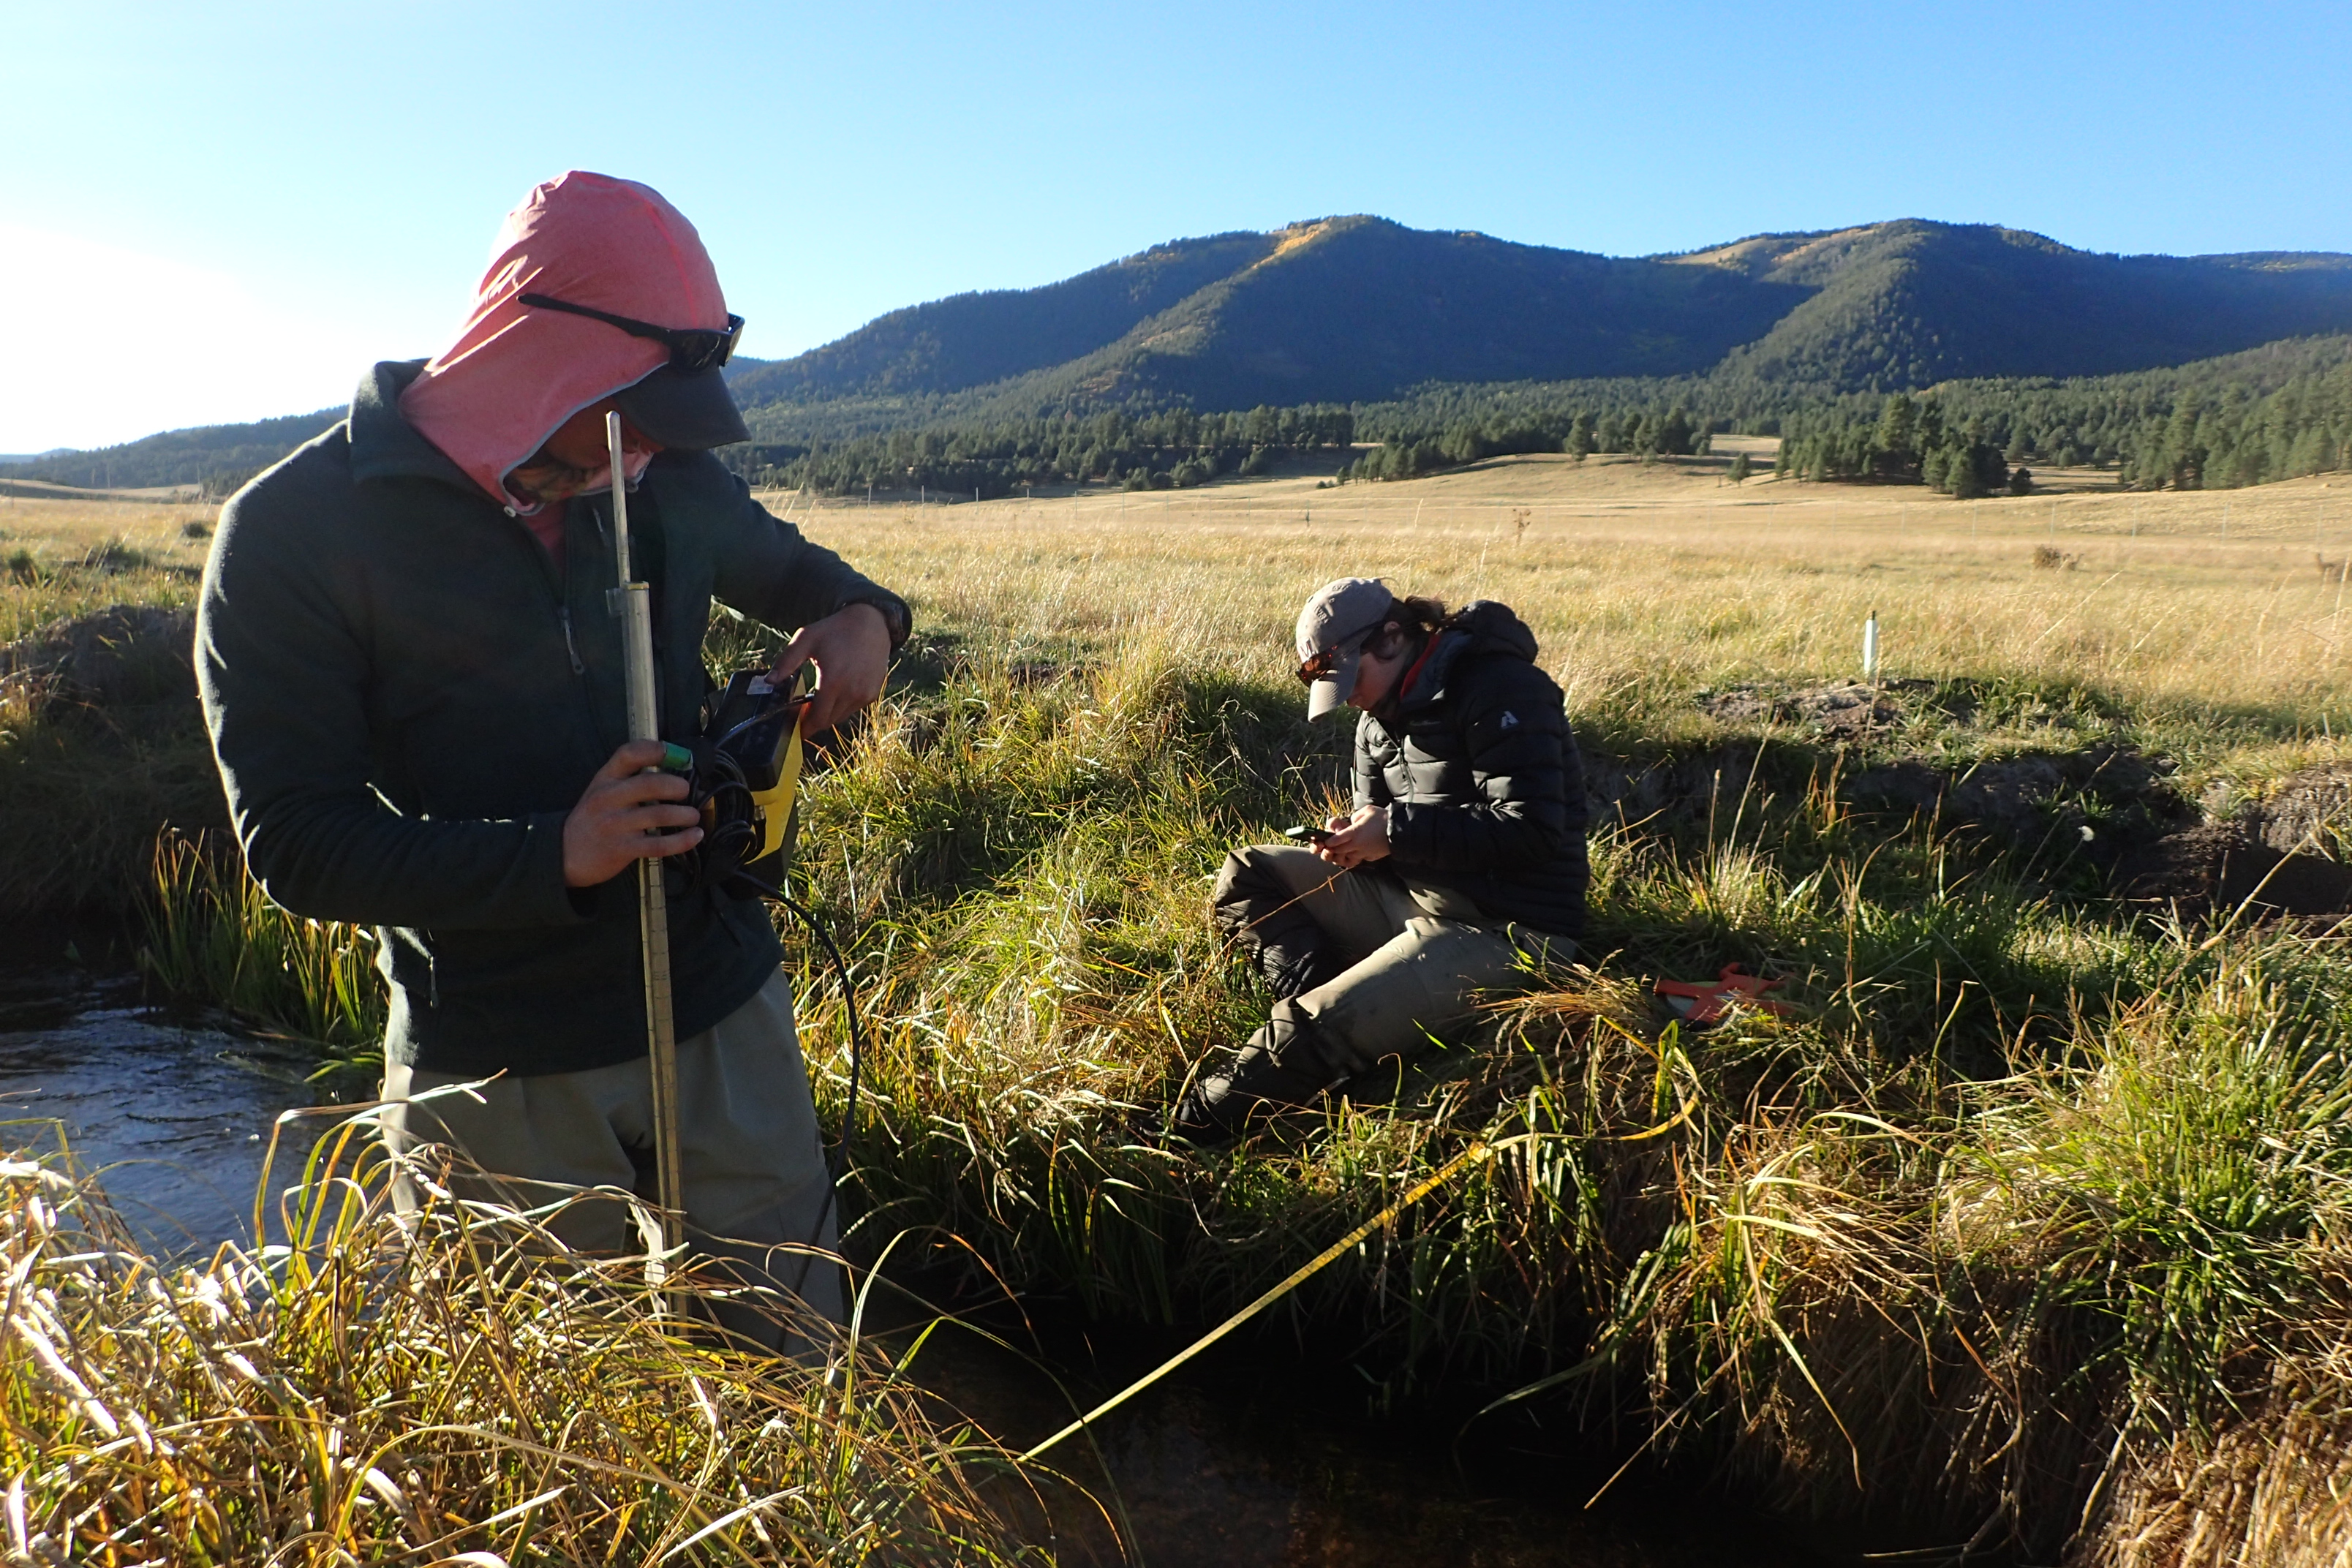
4c. Velocity measurements are taken at regular intervals along a cross-section of the channel. Photo: L. Flynn
Substrate
Streambeds are usually composed of many types of substrate including silt, sand, gravel, cobble, boulder, and bedrock (Figure 5a). These substrates are classified by their size. A popular approach is the pebble count, where scientists randomly sample (Figure 5b) and then measure (Figure 5c) 100 particles from the streambed. Understanding the substrate informs biologists about the stream’s hydrological features (riffles tend to have cobbles, pools tend to have silt) and helps to determine the suitability of the stream for reproduction since trout and salmon require gravel to build redds (nests for their eggs).
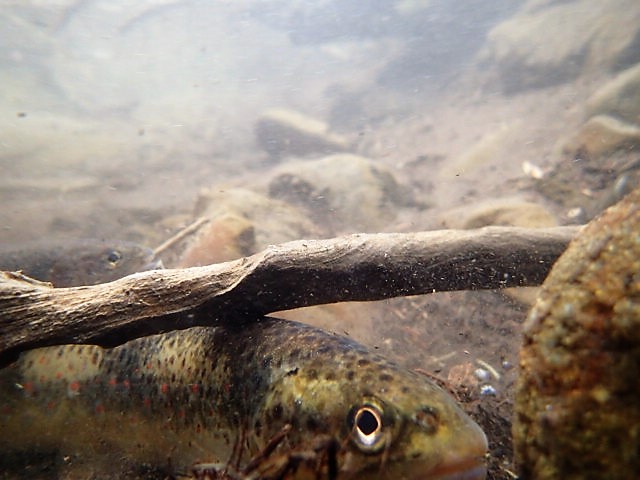
Figure 5a. Brown trout resting on a silty, cobbly substrate. Photo: L. Flynn.
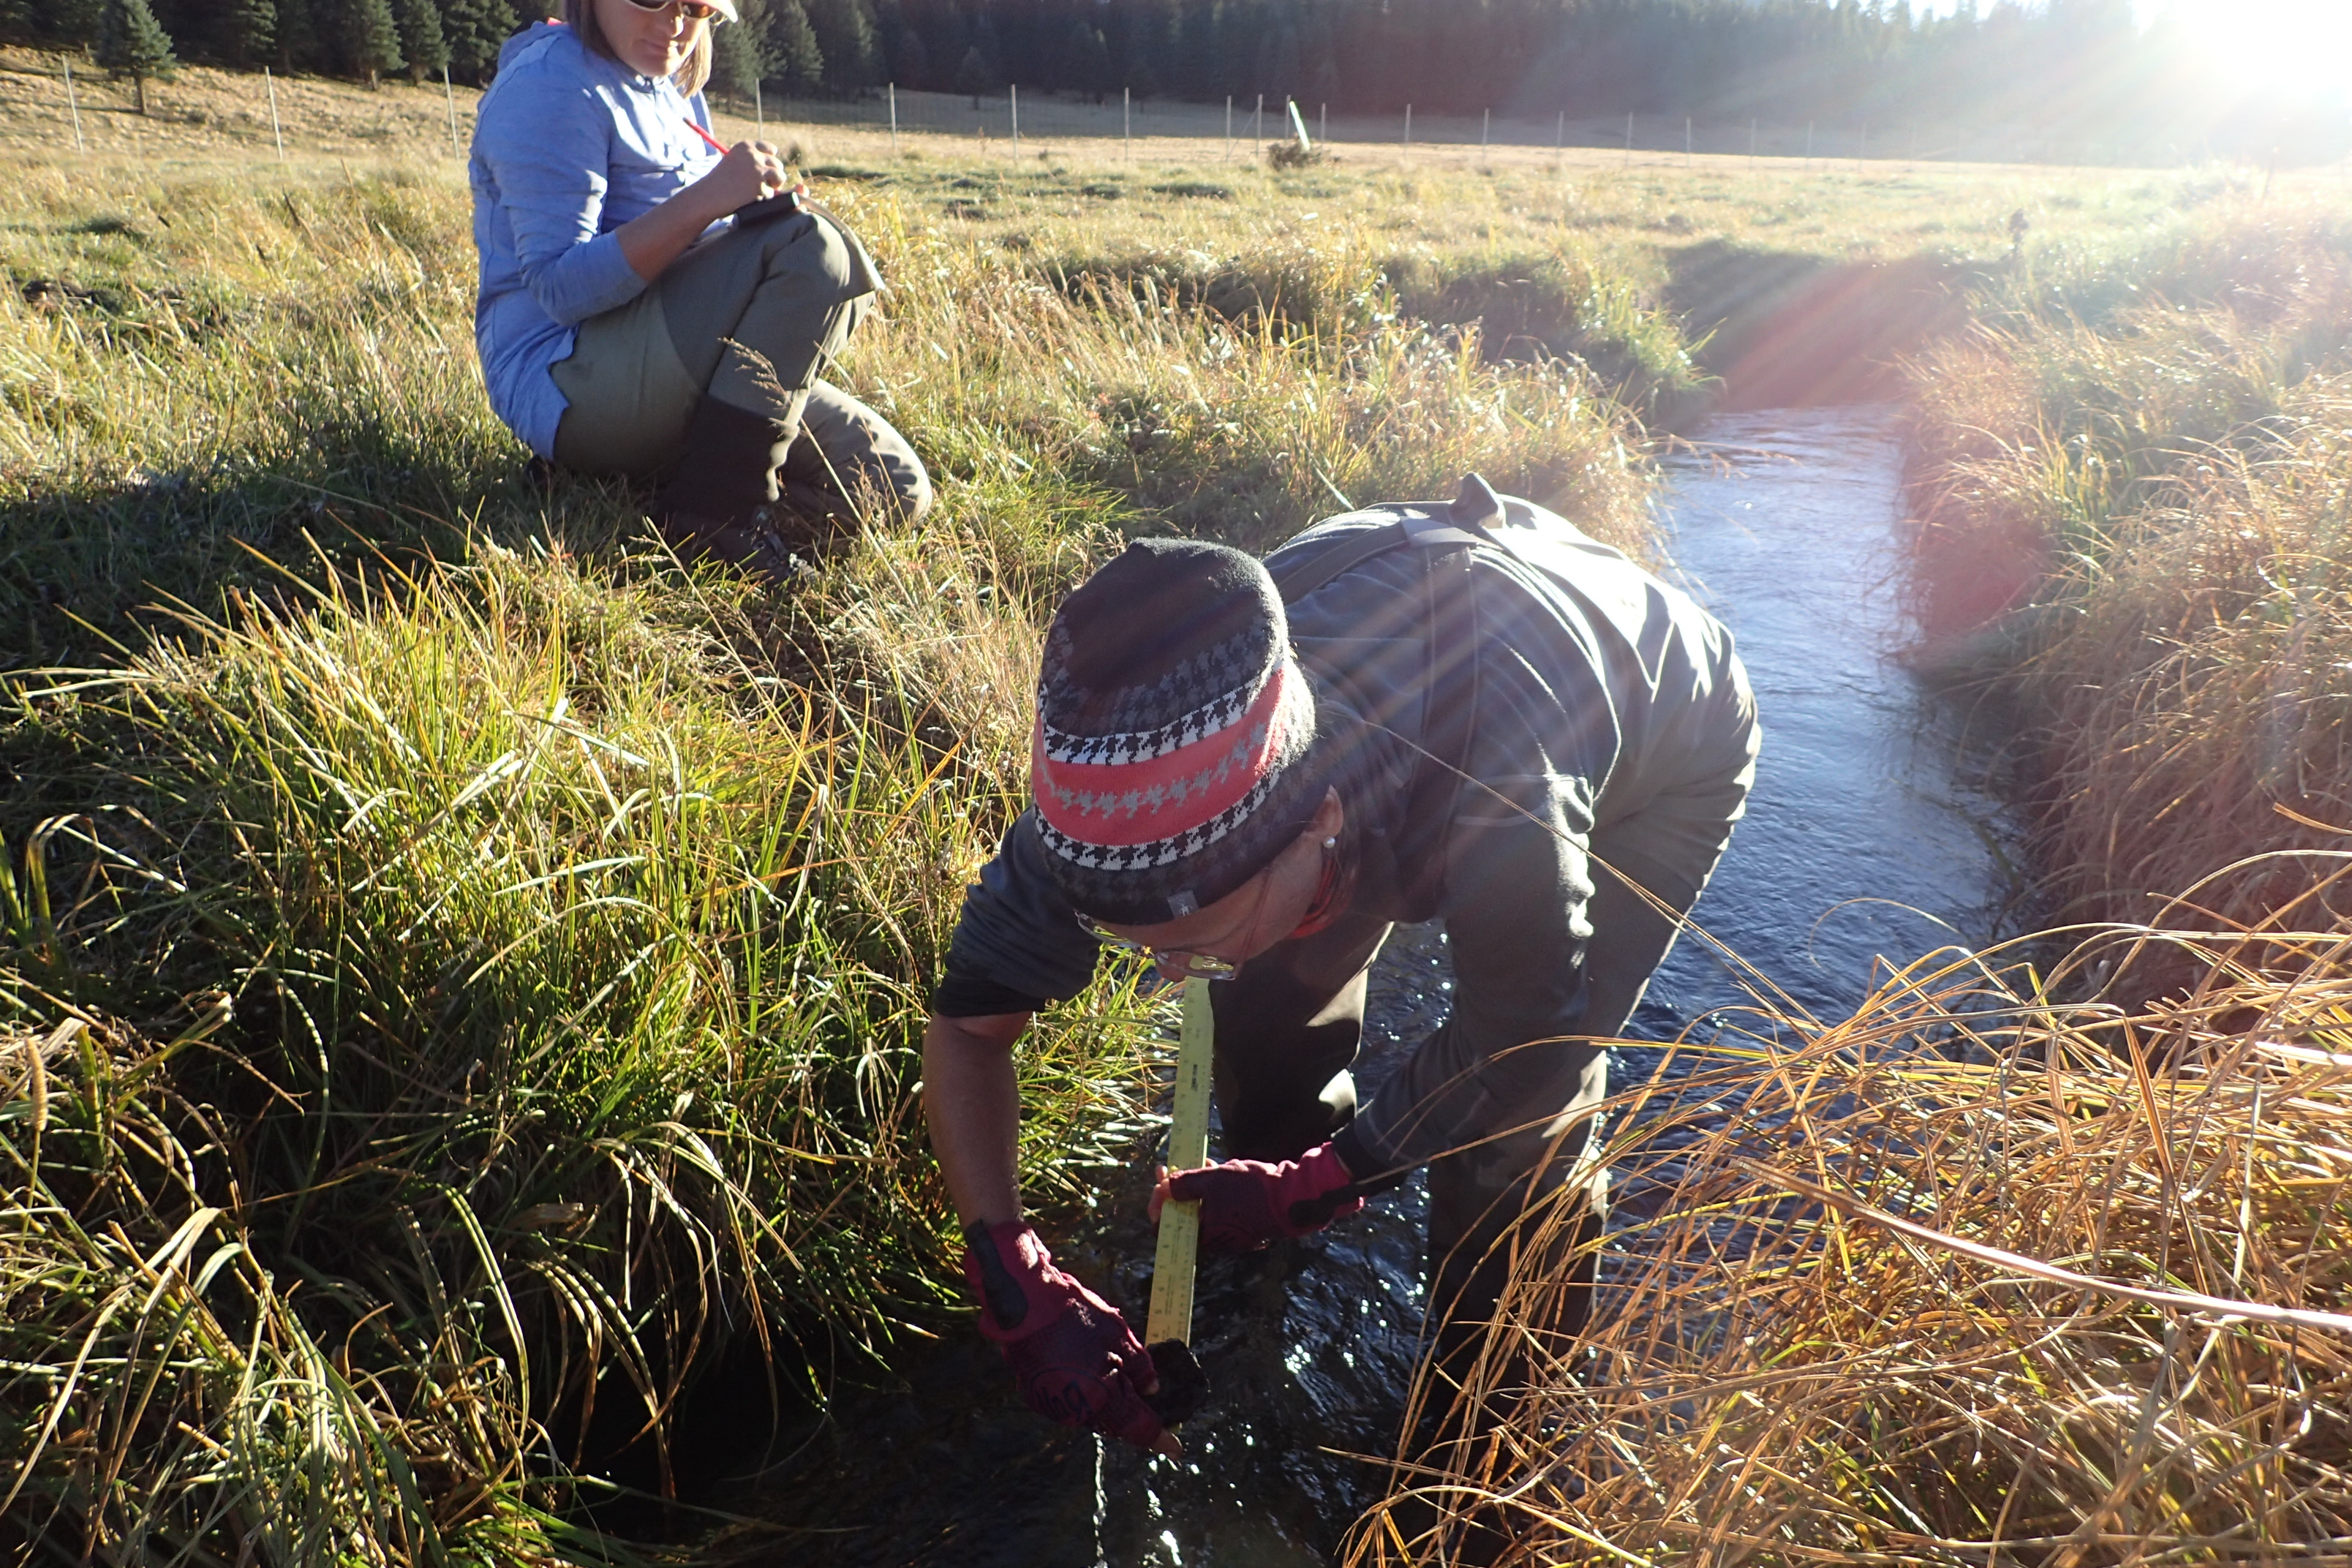
Figure 5b. Pebble counts require a random selection of particles from the streambed. Photo: L. Flynn.
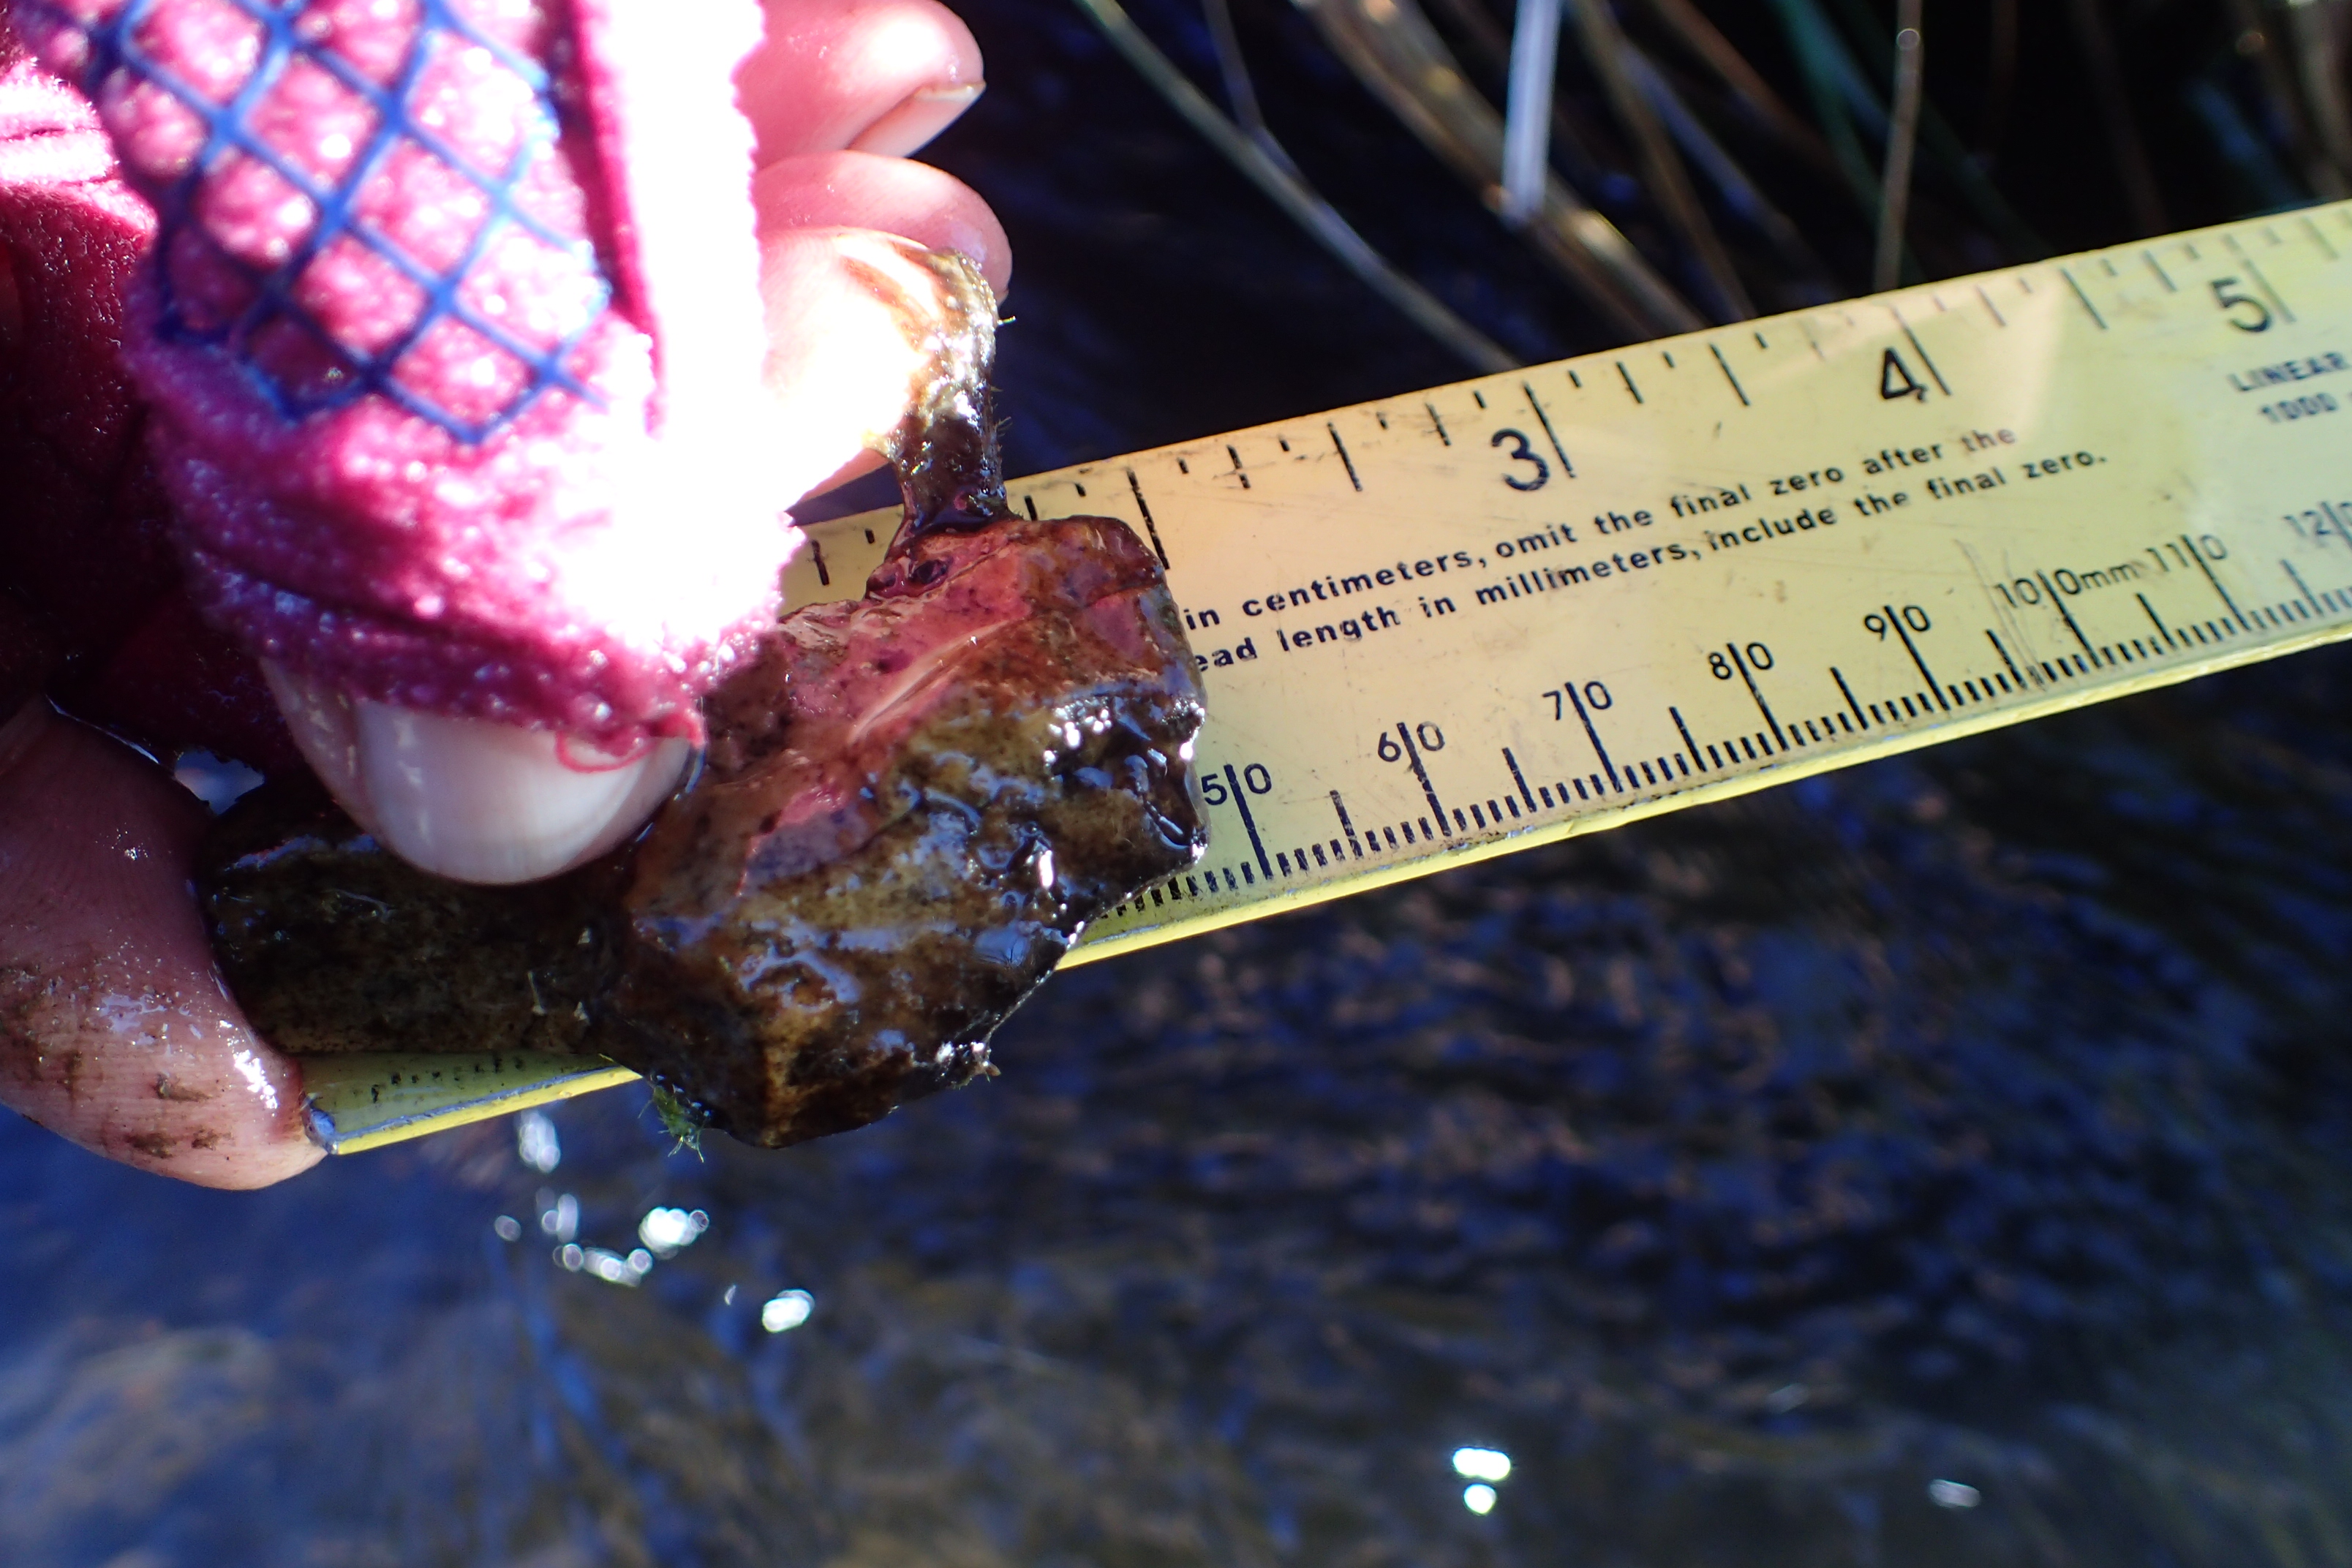
Figure 5c. Measuring the long axis of the pebble. Photo: L. Flynn.
Final Thoughts
A common theme in these photographs is teamwork. Efficiently gathering high-quality habitat data is challenging to do alone, so scientists commonly work in teams and divide the labor. For example, one person collects depth and velocity, a second person collects the pebble count and wetted width, and a third records the data (Figure 6a). Excellent communication and interpersonal skills are critical for all data collections. In addition, taking hundreds of measurements can be extremely tedious and demand so much focus that you can lose awareness of your surroundings and your perspective. Teams counteract both of these pitfalls. Streams are dynamic environments, and teams provide multiples lines of sight on potential hazards. Most importantly, they help to keep the focus on the larger scope and motivation of your research, which in our case is the conservation of the Rio Grande Cutthroat (Figure 6b).
We hope that you find this guide helpful as you assess the habitat health of your own local stream, and that it helps you conserve the fish populations that call your stream home.
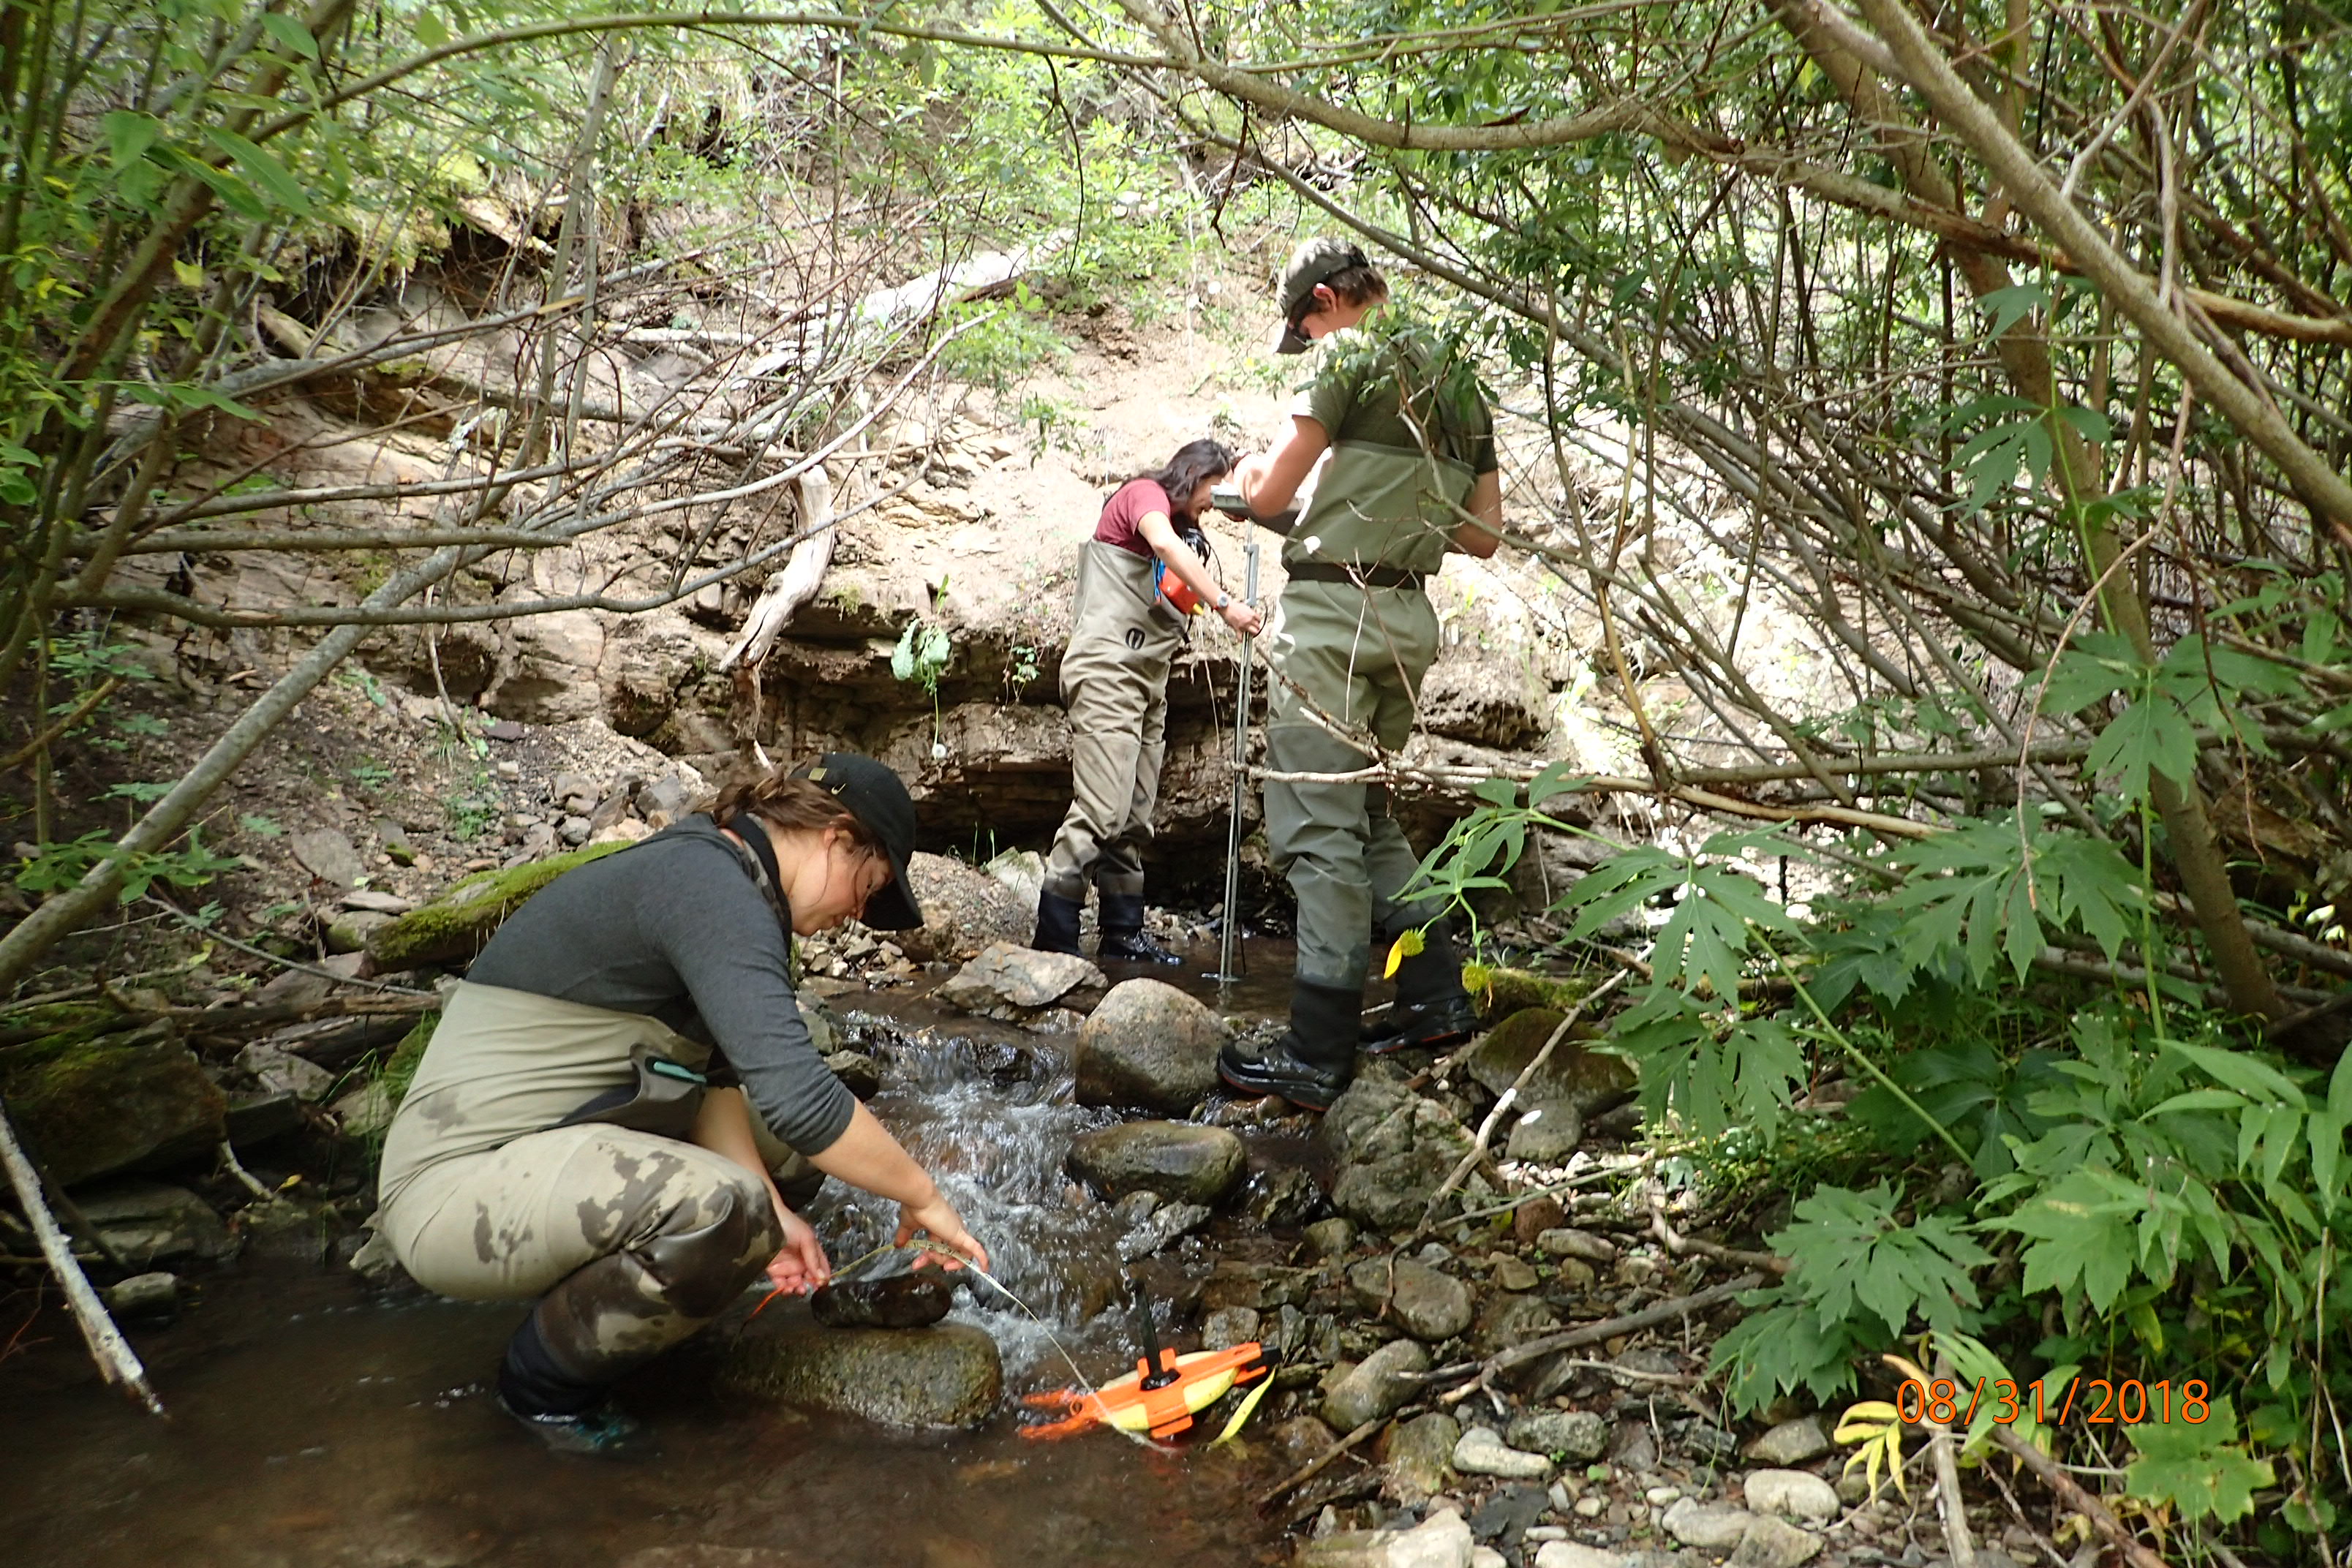
Figure 6a. A finely-tuned data gathering machine. Photo: C. Caldwell.
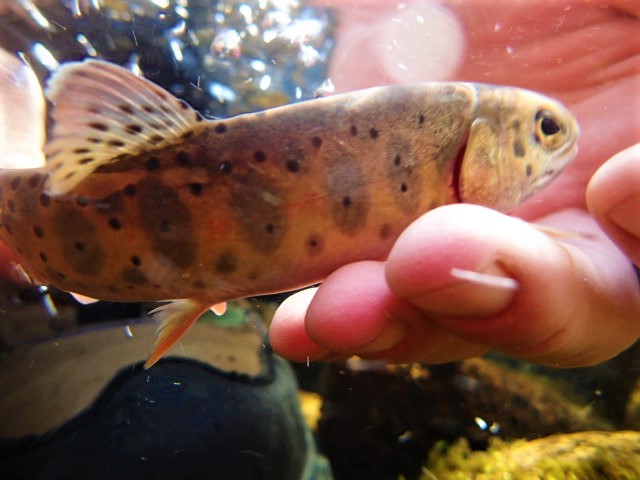
Figure 6b. Juvenile Rio Grande Cutthroat Trout. Photo: L. Flynn.