Identifying Redband Trout habitat: Aerial images worked as well as field data!
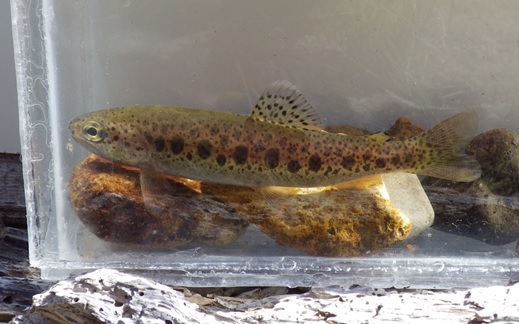
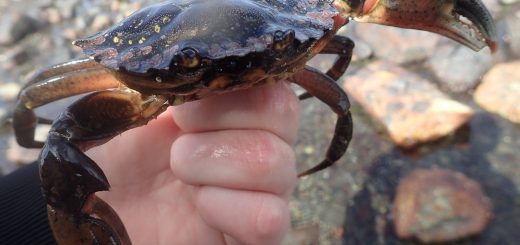
Redband Trout (above) are threatened by changing stream habitat.
Scientists and managers working to conserve Redband Trout faced a problem: These fish live in remote, desert streams that can be difficult and expensive to study. Yet, managers and nonprofit organizations require more information on the Redband Trout in order to conserve and restore their populations. How could researchers gain this important information? They essentially did the same thing that many modern trout fishermen do: find likely locations using aerial photos on their computer! However, here is where the research by Dr. Daniel Dauwalter, Dr. Kurt Fesenmyer, and Dr. Robin Bjork departs from the typical trout fishermen.

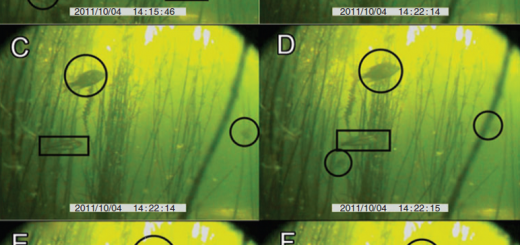
Dauwalter and colleagues used infrared aerial photographs from the National Agricultural Imagery Program (top) to map land cover (bottom) and predict Redband Trout occurrence and density.
In their research recently published in the Transactions of the American Fisheries Society, Dauwalter and colleagues developed a method for predicting the likely occurrence and density of Redband Trout in Salmon Falls Creek and the Owyhee River basins in Oregon, Idaho, and Nevada. “Livestock grazing is a major land use that has impacted streams in the study area. Redband trout are a sport fish, an indicator species, are listed as a ‘sensitive species’ by land management agencies, and are a ‘species of concern’ for state agencies,” said Dauwalter. The researchers from Trout Unlimited used publicly available aerial photographs collected by the National Agricultural Imagery Program to identify land cover along the riparian habitats of potential Redband Trout streams. Dauwalter and colleagues mapped the presence of woody vegetation in riparian habitats, which they were able to classify at high resolution (1 m2) and accuracy. This method was far easier than traditional methods of habitat assessment, which would have required physically traveling the length of the river segments in question to assess and map them. They then used a model of stream temperature (NorWeST) to obtain predictions of mean August stream temperatures in each stream segment, which are important to the thermally-sensitive Redband Trout. Finally, they compared data on Redband Trout from electrofishing surveys to these habitat variables in order to predict the occurrence and density of the trout.
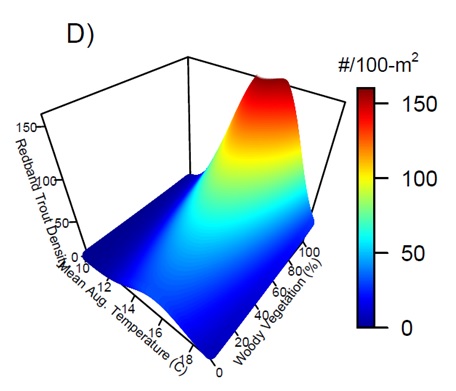
Dauwalter and colleagues used statistical models (a logistic regression) to predict Redband Trout density based upon mean August water temperatures and the percentage of woody vegetation in the riparian zone of streams. Reproduced from Dauwalter et al. 2015.
Dauwalter and colleagues found that, as expected, they were able to predict the occurrence and density of Redband Trout with high accuracy using woody riparian vegetation and stream temperature. They were curious how their predictions fared with respect to a more complex model that they might create if they were to complete labor-intensive, on-site field surveys for these remote streams. They were surprised to find that the maps based on aerial photos and modeled stream temperatures actually produced more plausible fish predictions than field data. Their results show that Redband Trout are found more commonly and at higher densities in areas with wooded vegetation, as mapped using aerial imagery, especially when stream temperatures were not too hot or too cold – the temperature sweet-spot for trout.
What does this mean for fish habitat managers, nonprofits, and stakeholders working to conserve Redband Trout? “Since the aerial imagery and stream temperatures are spatial data for all stream segments, that information can be used to identify streams that are thermally marginal for Redband trout and that could benefit from riparian restoration to improve those marginal habitats,” says Dauwalter. He recommends increased conservation and restoration of woody vegetation in riparian habitats to shade the stream, decrease water temperatures, and provide a source of in-stream woody habitat for the fish. Due to their research, those streams could now be identified using free aerial imagery along with available maps of stream temperature.