Finding the best model to predict fish distribution
Accurate knowledge of fish distribution and preferred habitat is crucial to managing fisheries using an ecosystem-based management approach. For many fisheries, however, it is difficult to obtain information regarding the spatial distribution of fish species and how environmental conditions shape these distributions. These problems are particularly severe for deep-water fish that live on the ocean floor, called bottomfish, since these species tend to be hard to sample and thus, not much is known about them. Developing a good understanding of the habitat bottomfish occupy is crucial in order to support these commercially important species and ensure that they are managed and harvested sustainably. New modelling approaches can help address this need. One such type of model is a species distribution model. These models are powerful tools for understanding relationships between species and their environment and predicting species distributions in previously unsampled locations.
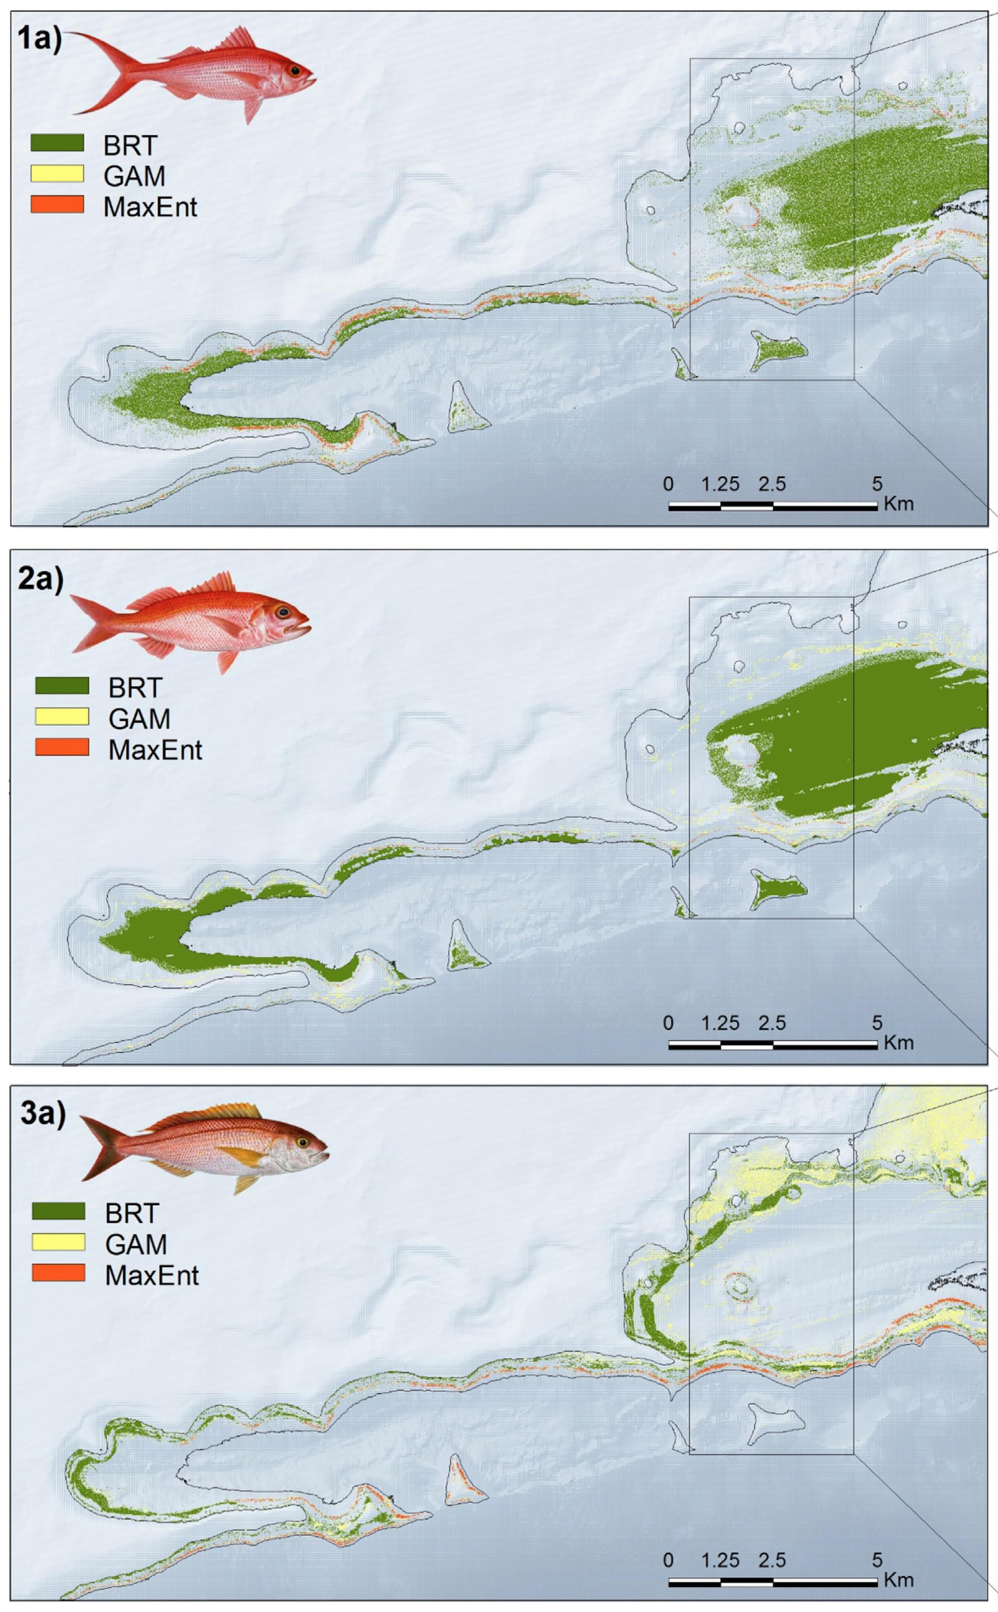
Figure 1. Differences in habitat distribution (in water between 100 – 300m in depth) predicted by each of the three models for each fish species. The top row (1) depicts distribution of E. coruscans, the center row (2) depicts distribution of E. carbunculus, and the bottom row (3) depicts distribution of P. filamentosus.
Dr. Cordelia Moore and her coauthors developed species distribution models for three commercially valuable species of deep-water snappers off of Hawaii’s coast: Etelis coruscans, Etelis carbunculus, and Pristipomoides filamentosus. These three species are the most abundant deep-water bottomfishes in Hawaii and are of great commercial importance to the Hawaiian deep-water fisheries. For this particular study, the fish were located in area “F” of Hawaii’s bottomfish restricted fishing areas (BRFAs), off the coast of Molokai, Hawaii, and one of the most important fishing grounds in the Main Hawaiian Islands. The models were then compared, in terms of performance and distributional accuracy, using three different methods: Generalised Additive Models (GAM), Boosted Regression Trees (BRT), and Maximum Entropy (MaxEnt).
Of the three models, for all three fish species, MaxEnt produced the most accurate predictions of fish habitat location and fish distribution (Figure 1). Although each model differed in the factor identified as being most important in determining species distributions, depth was an important explanatory variable across all three modelling approaches. The comparisons also showed that each species preferred unique combinations of environmental conditions, terrain, and substrate. E. coruscans, for example, preferred deep, steeply sloping habitats with little flat, unconsolidated substrate while E. carbunculus preferred slightly deeper habitat, but with similar terrain and substrate features (Figure 2).
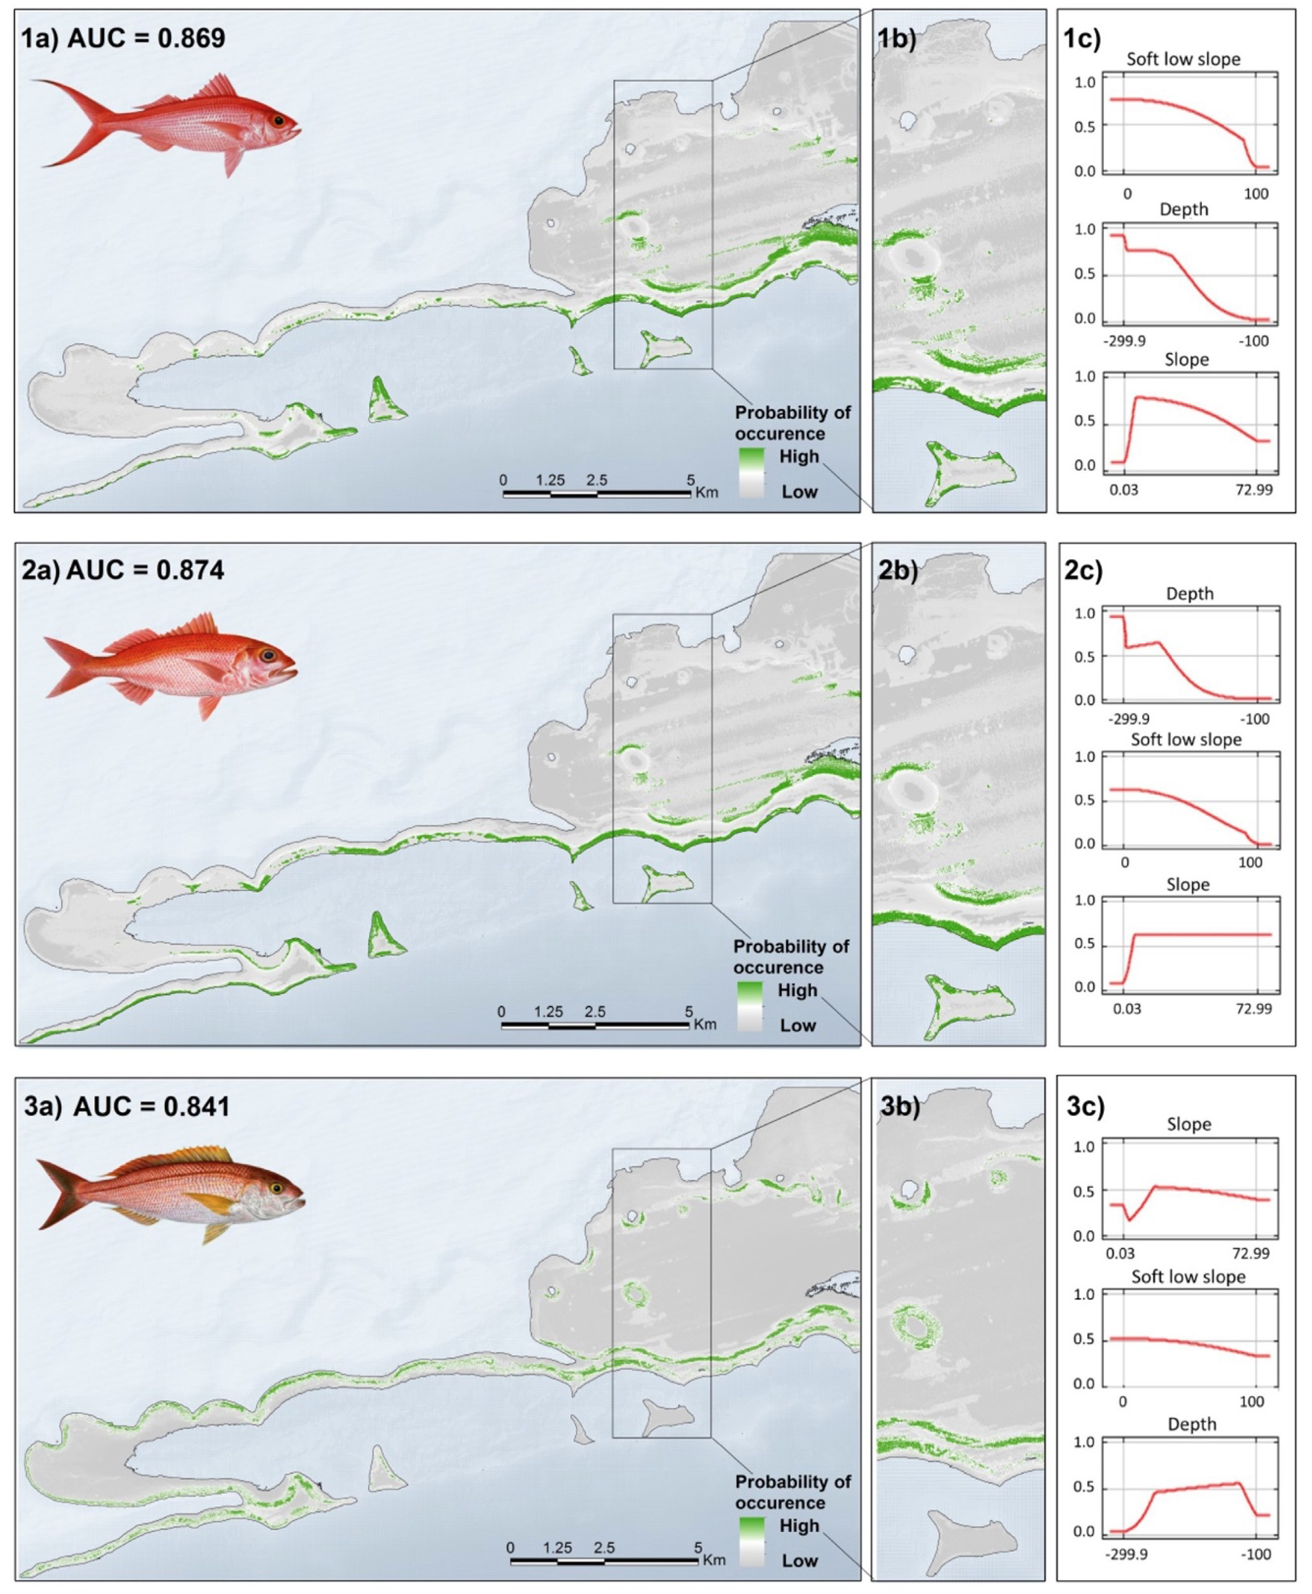
Figure 2. Habitat distributions predicted using MaxEnt for each bottomfish species. The top row (1) is E. coruscans, middle row (2) is E. carbunculus, and the bottom row (3) is P. filamentosus. Panels on the far left (a) show the distribution across the study area for each species, with the center panels (b) providing a close-up look for a section of the study area. The far right panels (c) show the response curves for each species for the three main predictor variables of the model: terrain (slope), substrate (soft low slope), and depth.
The authors also compared the habitat locations predicted by MaxEnt to the areas currently protected by Hawaii’s fishing regulations. They found that, in water between 100 and 300m in depth, all three fish species co-occurred in 18.9% of the research area while 2.1% of the research area was habitat for at least 2 of the fish species. There were also parts of the research area that were only occupied by one of the fish species: 0.7% unique to E. coruscans, 6.7% unique to E. carbunculus, and 7.3% unique to P. filamentosus. The results from this study can help scientists determine which areas are important to protect in order to ensure the bottomfish populations are sustainably harvested. Additionally, this study gives insight into which model is best for predicting distribution of snappers, as well as other deep-water fish species, which can be especially useful in cases where little is known about the habitat preferences and distributions of specific deep-water fish species.
Reference:
Moore, C., Drazen, J. C., Radford, B. T., Kelly, C., Newman, S. J.. 2016. Improving essential fish habitat designation to support sustainable ecosystem-based fisheries management. Marine Policy, 69, 32 – 41.